India to South Africa: Burnol Export Trade Route
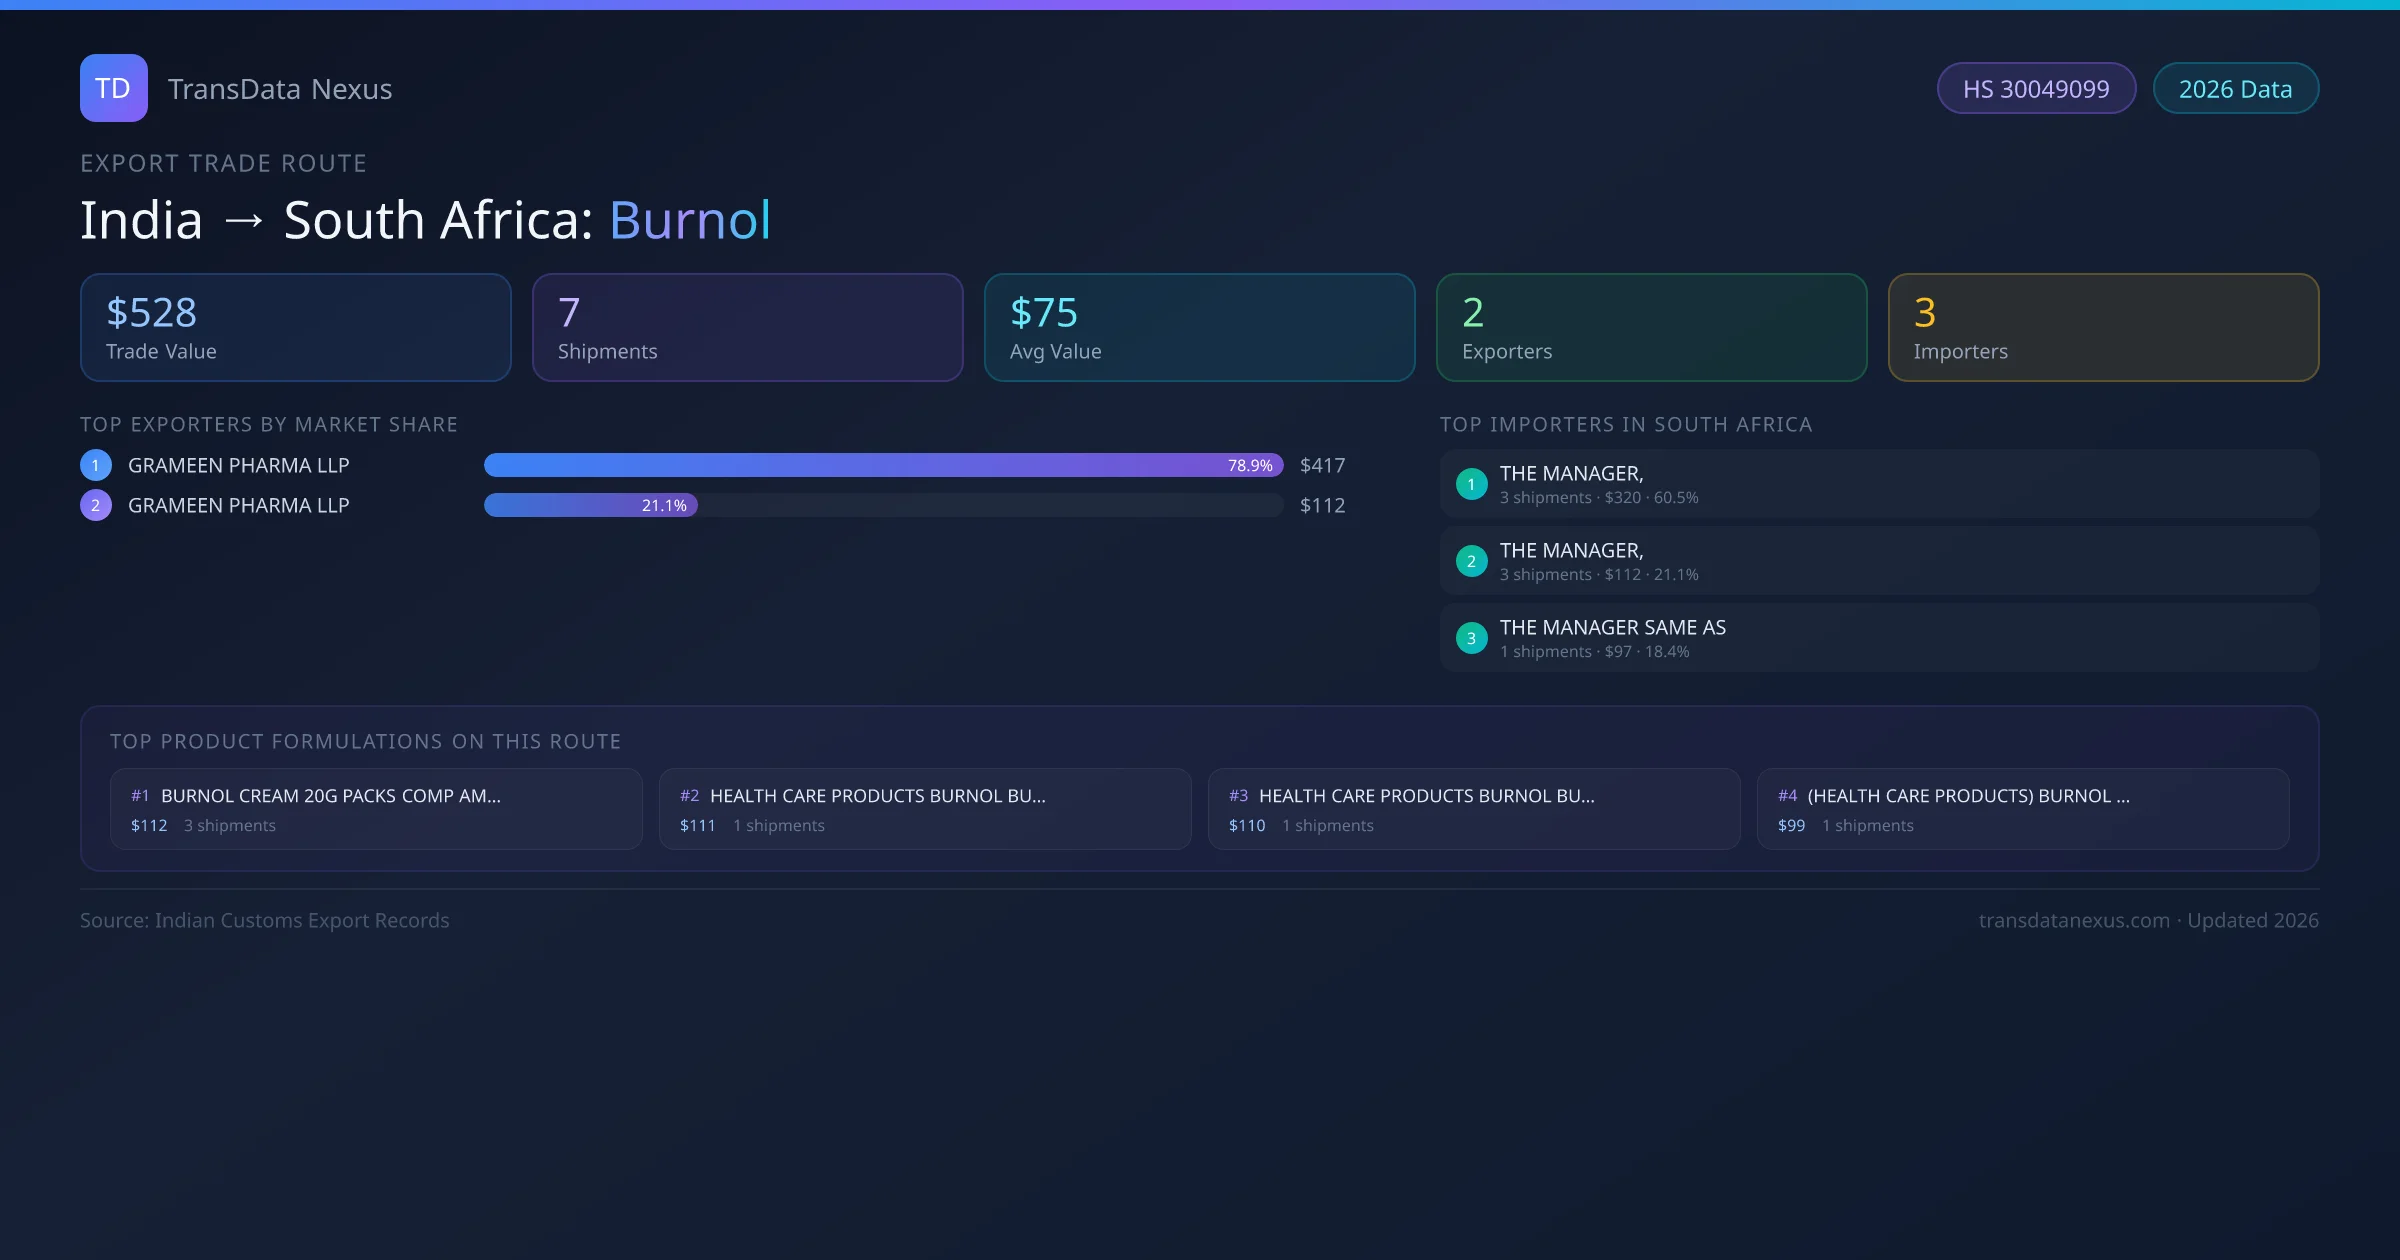
India has recorded 7 verified shipments of Burnol exported to South Africa, representing a combined trade value of $528 USD. This corridor is served by 2 active Indian exporters, with an average shipment value of $75 USD. The leading Indian exporter is GRAMEEN PHARMA LLP, which accounts for 79% of total export value with 4 shipments worth $417 USD. On the buying side, THE MANAGER, is the largest importer in South Africa with $320 USD in purchases. All data sourced from Indian Customs (DGFT) shipping bill records. Values reported in FOB USD.
Route Intelligence Overview
The India to South Africa Burnol corridor is one of India's established pharmaceutical export routes, with 7 shipments documented worth a combined $528 USD. The route is dominated by GRAMEEN PHARMA LLP, which alone accounts for roughly 79% of all export value, reflecting the consolidated nature of India's burnol manufacturing sector.
Across 2 active suppliers, the average shipment value stands at $75 USD — a figure that reflects both bulk commercial orders from large pharmaceutical companies and smaller specialty shipments. Sea freight dominates at 82% of all shipments, consistent with burnol's non-urgent bulk-order profile.
Shipment activity peaks during July–September, with an average transit time of 23 days port-to-port. The route has recorded an annual growth rate of 30.8%, placing it at rank #10 among India's top burnol export destinations globally.
On the import side, key buyers of Indian burnol in South Africa include THE MANAGER,, THE MANAGER, , THE MANAGER SAME AS. THE MANAGER, is the single largest importer with 3 shipments valued at $320 USD.
Route Characteristics
- Average transit23 days
- Peak seasonQ3
- Primary modeSea freight
- Top portNHAVA SHEVA SEA (INNSA1)
Market Position
- Global rank#10
- Annual growth+30.8%
- Demand growth+27.5%
- Regulatory ease86/100
Top 10 Indian Burnol Exporters to South Africa
Showing top 10 of 2 Indian suppliers exporting Burnol to South Africa, ranked by total trade value (USD)
| Rank | Supplier (Indian Exporter) | Shipments | Total Value (USD) | Market Share |
|---|---|---|---|---|
| 1 | GRAMEEN PHARMA LLP Avg $104 per shipment | 4 | $417 | 78.9% |
| 2 | GRAMEEN PHARMA LLP Avg $37 per shipment | 3 | $112 | 21.1% |
This table shows the top 10 of 2 Indian companies exporting burnol to South Africa, ranked by total trade value. The listed exporters are: GRAMEEN PHARMA LLP, GRAMEEN PHARMA LLP . GRAMEEN PHARMA LLP is the dominant supplier with 4 shipments worth $417 USD, giving it a 79% market share.
Top 10 Burnol Importers in South Africa
Showing top 10 of 3 known buyers in South Africa receiving Burnol shipments from India, ranked by import value
On the receiving end of this trade route, the leading importers of Indian burnol in South Africa include THE MANAGER,, THE MANAGER, , THE MANAGER SAME AS. The largest importer is THE MANAGER,, accounting for $320 USD across 3 shipments — representing 61% of all burnol imports from India on this route.
| Rank | Importer / Buyer | Shipments | Import Value (USD) | Market Share |
|---|---|---|---|---|
| 1 | THE MANAGER, | 3 | $320 | 60.5% |
| 2 | THE MANAGER, | 3 | $112 | 21.1% |
| 3 | THE MANAGER SAME AS | 1 | $97 | 18.4% |
Top 10 Burnol Formulations Imported by South Africa
Showing top 10 of 5 product formulations shipped on the India to South Africa Burnol route, ranked by trade value
South Africa imports a wide range of burnol formulations from India, spanning tablets, capsules, suspensions, and combination drugs. The top formulation — BURNOL CREAM 20G PACKS COMP AMINACRINE — accounts for $112 USD across 3 shipments. A total of 5 product variants have been identified in the shipment records.
| Rank | Product Formulation | Shipments | Trade Value (USD) | Market Share |
|---|---|---|---|---|
| 1 | BURNOL CREAM 20G PACKS COMP AMINACRINE | 3 | $112 | 21.1% |
| 2 | HEALTH CARE PRODUCTS BURNOL BURNS CREAM25G (OTHER DETAILS AS PER INVOICE) | 1 | $111 | 21.0% |
| 3 | HEALTH CARE PRODUCTS BURNOL BURNS CREAM100 TUBES PACK 25G (OTHER DETAILS AS PERINVOICE)NOS | 1 | $110 | 20.9% |
| 4 | (HEALTH CARE PRODUCTS) BURNOL CREAM 20G. | 1 | $99 | 18.6% |
| 5 | HEALTH CARE PRODUCTS BURNOL CREAM PACK 20G 100 TUBES OTHER DETAILS AS PER DOCUMENT | 1 | $97 | 18.4% |
Shipping & Logistics Analysis
Freight mode split and port-of-origin breakdown
Freight Mode Distribution
Sea freight dominates at 82%, typical for bulk pharmaceutical shipments.
Top Ports of Origin
NHAVA SHEVA SEA (INNSA1) handles the highest volume with 4 shipments. Transit time averages 23 days by sea.
Market Dynamics
India's burnol exports to South Africa are driven primarily by a handful of large-scale manufacturers. GRAMEEN PHARMA LLP with 4 shipments leads the pack, a pattern common in generic pharmaceutical corridors where manufacturing scale creates significant cost advantages. The presence of 2 active exporters signals a competitive but concentrated market — buyers in South Africa benefit from supplier diversity while the top tier handles the majority of volume.
The top 3 suppliers — GRAMEEN PHARMA LLP, GRAMEEN PHARMA LLP — together account for 100% of total trade value on this route. The average shipment value of $75 USD reflects a mix of bulk commercial orders and smaller specialty shipments.
Beyond the primary product category, shipments on this route include closely related formulations such as health care products burnol burns cream25g (other details as per invoice) and health care products burnol burns cream100 tubes pack 25g (other details as perinvoice)nos, suggesting that buyers in South Africa tend to consolidate orders across related product lines from the same Indian supplier.
On the buying side, THE MANAGER, is the largest importer with 3 shipments worth $320 USD — representing 61% of all burnol imports from India on this route.
Route Statistics
- Trade Volume
- $528
- Avg. Shipment
- $75
- Suppliers
- 2
- Buyers
- 3
- Transit (Sea)
- ~23 days
- Annual Growth
- +30.8%
Other Burnol Routes
Unlock the Full India to South Africa Burnol Dataset
TransData Nexus provides verified shipment-level records, supplier contact details, HS code breakdowns, real-time pricing benchmarks, and regulatory compliance guides for 7 shipments on this route.
Frequently Asked Questions — India to South Africa Burnol Trade
Answers based on Indian Customs (DGFT) shipment records compiled by TransData Nexus
Q Which Indian companies export Burnol to South Africa?
The leading Indian exporters of Burnol to South Africa are GRAMEEN PHARMA LLP, GRAMEEN PHARMA LLP . GRAMEEN PHARMA LLP holds the largest market share at approximately 79% of total trade value on this route.
Q What is the total value of Burnol exports from India to South Africa?
India exports Burnol to South Africa worth approximately $528 USD across 7 recorded shipments. The average value per shipment is $75 USD.
Q Which ports does India use to ship Burnol to South Africa?
The most active port of origin is NHAVA SHEVA SEA (INNSA1) with 4 shipments. Indian exporters primarily use sea freight for this route, with 82% of shipments going by sea and 28% by air.
Q How long does shipping take from India to South Africa for Burnol?
The average transit time for Burnol shipments from India to South Africa is approximately 23 days. Sea freight typically takes longer, while air freight can reduce this significantly for urgent orders. Peak shipping activity is observed during July–September.
Q Is the India to South Africa Burnol trade route growing?
Yes — this trade corridor has seen an annual growth rate of approximately 30.8% with demand growth tracking at 27.5%. The route is ranked #10 among India's top Burnol export destinations globally.
Q How many suppliers are active on the India to South Africa Burnol route?
There are currently 2 active Indian suppliers exporting Burnol to South Africa. The market is moderately concentrated with GRAMEEN PHARMA LLP accounting for 79% of total shipment value.
Q Who are the main importers of Burnol from India in South Africa?
The leading importers of Indian Burnol in South Africa include THE MANAGER,, THE MANAGER, , THE MANAGER SAME AS. THE MANAGER, is the largest buyer with 3 shipments worth $320 USD.
Official References & Regulatory Resources
- India Trade Statistics (DGFT)
- Invest India — Pharma Sector
- WCO HS Nomenclature
- Ministry of Commerce — Pharma Exports
- Pharmexcil
Data sourced from Indian Customs (DGFT) records. Verify regulatory and trade status with the agencies above.
Research Methodology & Data Transparency
Suresh Sormare
Verified AuthorPharmaceutical Export-Import Analyst & Trade Intelligence Expert
Suresh Sormare is a pharmaceutical export-import analyst with deep expertise in Indian Customs (DGFT) data, HS code classification, and global pharmaceutical supply chains. His analysis covers 10M+ shipment records across 150+ countries and is used by manufacturers, procurement agencies, and trade consultants worldwide. Suresh specializes in identifying verified suppliers and buyers from customs records, mapping bilateral pharmaceutical trade corridors, analyzing tariff structures and regulatory frameworks across 170+ destination markets, and benchmarking competitive positioning for finished pharmaceutical formulations. His methodology combines granular customs transaction data with regulatory intelligence from FDA, EMA, WHO, CDSCO, and 40+ national drug authorities to deliver actionable trade insights for the pharmaceutical formulations sector.
linkedin.com/in/sureshsormarePrimary Data Source
All trade data is sourced from Indian Customs (DGFT) official shipping bill records — the authoritative government database for India's pharmaceutical trade. Each verified record contains exporter name, consignee (buyer) name, detailed product description, quantity, declared FOB value (USD), port of loading, destination country, and shipment date.
Analysis Methodology
- 1.Route Identification: India to South Africa export trade corridor identified from Indian Customs (DGFT) records for Burnol.
- 2.Supplier/Buyer Matching: 2 Indian exporters and 3 importers in South Africa matched using name normalization.
- 3.Value Aggregation: Total export value aggregated from 7 verified shipping bill records. Values are FOB in USD.
- 4.Market Share Analysis: Each supplier and buyer contribution calculated as a percentage of total route value. Statistical normalization applied to ensure accurate representation across varying shipment sizes.
Government-Sourced Data
Official DGFT customs records
Transparent Methodology
Calculations fully disclosed above
7 Verified Shipments
2 Indian exporters tracked
Expert-Reviewed
By pharmaceutical trade specialists