Flymax Exports & Imports — Taila Exporter Profile
Indian Pharmaceutical Exporter · #9 for Taila · $80.7K export value · DGFT Verified
Flymax Exports & Imports is the #9 Indian exporter of Taila with $80.7K in export value and 17 verified shipments. Flymax Exports & Imports holds a 1.1% market share in Taila exports across 2 countries.
Flymax Exports & Imports — Taila Export Profile: Buyers & Destinations
Where Does Flymax Exports & Imports Export Taila?
| Country | Value | Shipments | Share |
|---|---|---|---|
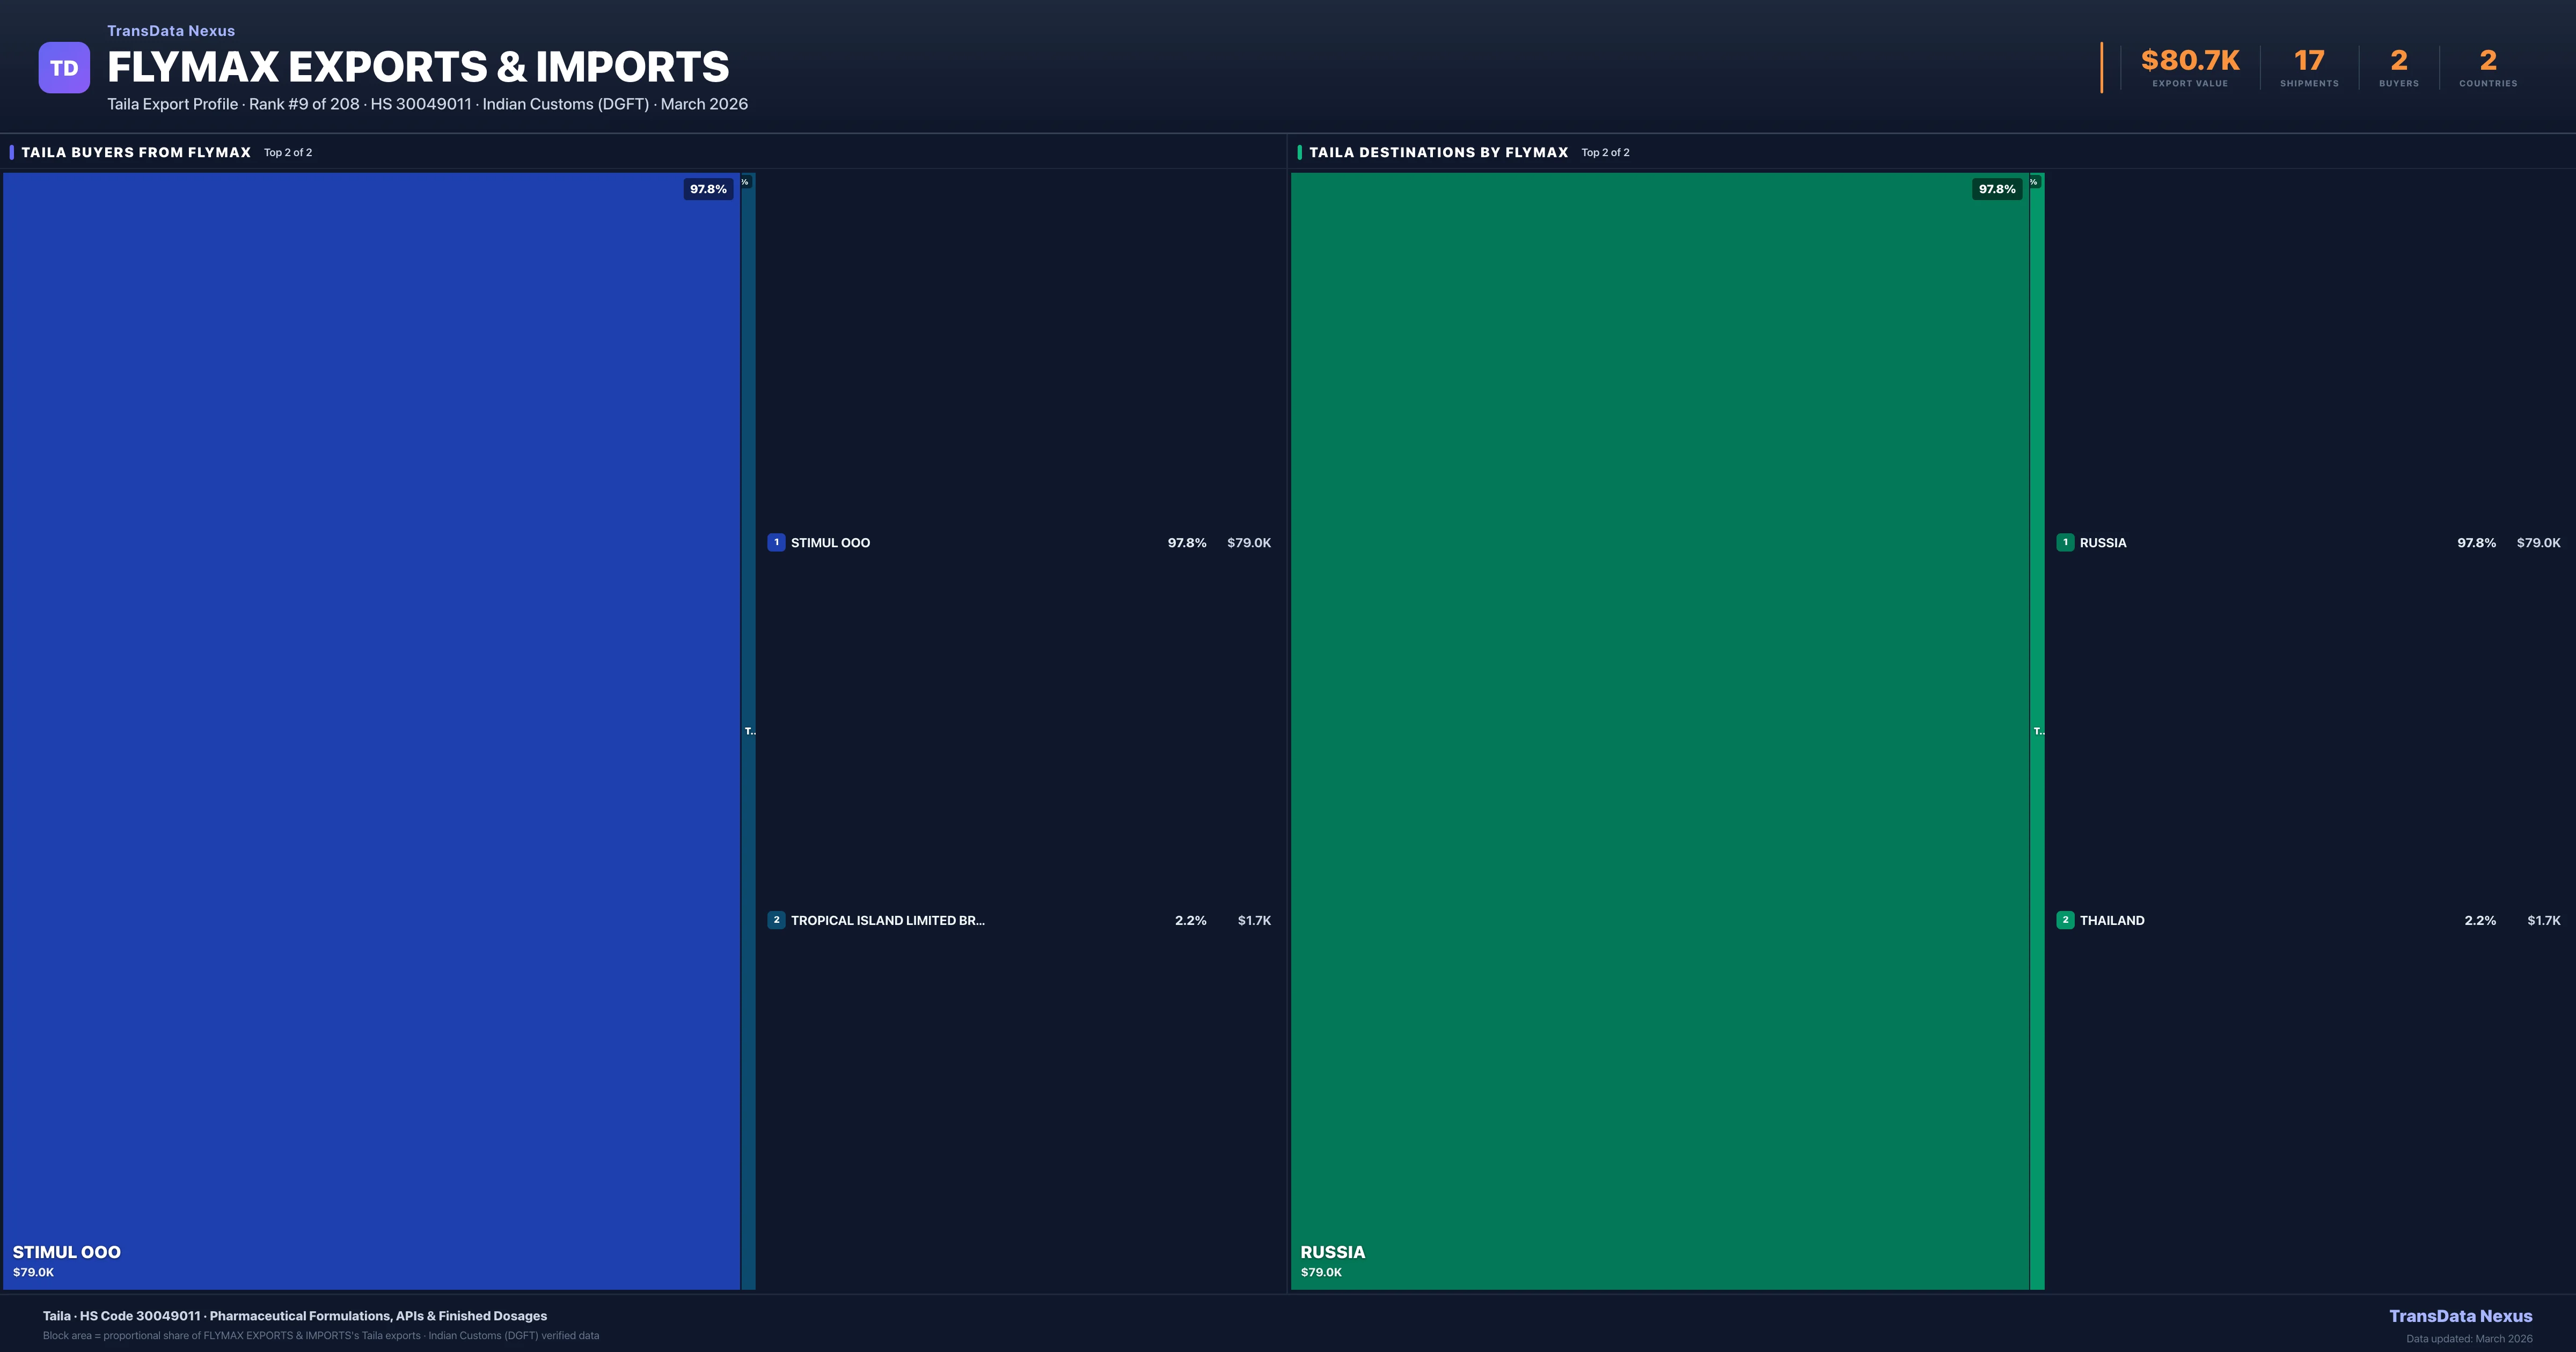
| RUSSIA | $79.0K | 12 | 97.8% |
| THAILAND | $1.7K | 5 | 2.2% |
Flymax Exports & Imports exports Taila to 2 countries. The largest destination is RUSSIA accounting for 97.8% of Flymax Exports & Imports's Taila shipments. These destinations reflect Flymax Exports & Imports's established distribution network and regulatory approvals in key markets.
Who Are the Top Buyers of Taila from Flymax Exports & Imports?
| Buyer | Country | Value | Orders |
|---|---|---|---|
| STIMUL OOO | RUSSIA | $79.0K | 12 |
| TROPICAL ISLAND LIMITED BRANCH 1 | THAILAND | $1.7K | 5 |
Flymax Exports & Imports supplies Taila to 2 buyers globally. The largest buyer is STIMUL OOO (RUSSIA). These buyers represent pharmaceutical distributors, hospital groups, and government procurement agencies in their respective markets.
What Is India's Total Taila Export Value and How Much Does Flymax Exports & Imports Contribute?
India exported $6.4M worth of Taila through 6,969 shipments from 208 suppliers to 82 countries, serving 381 buyers globally. Flymax Exports & Imports contributes $80.7K to this total, accounting for 1.1% of India's Taila exports. Flymax Exports & Imports ships Taila to 2 countries through 2 buyers.
What Is the Average Shipment Value for Flymax Exports & Imports's Taila Exports?
Flymax Exports & Imports's average Taila shipment value is $4.7K per consignment, based on 17 shipments totaling $80.7K. The largest destination is RUSSIA (97.8% of Flymax Exports & Imports's Taila exports).
How Does Flymax Exports & Imports Compare to Other Indian Taila Exporters?
Flymax Exports & Imports ranks #9 among 208 Indian Taila exporters with a 1.1% market share. The top 3 exporters are GREENSHIP EXPORTS ($3.8M), SNA OUSHADHASALA PRIVATE LIMITED ($791.9K), SWISS PARENTERALS LIMITED ($464.2K). Flymax Exports & Imports processed 17 shipments to 2 destination countries.
What Taila Formulations Does Flymax Exports & Imports Export?
| Product Description / Formulation | Value | Shipments |
|---|---|---|
| MAHA NARAYANA TAILAM | $32.3K | 1 |
| ELADI KERATAILAM | $27.8K | 1 |
| KSHIRABALA TAILAM | $11.2K | 1 |
| CHEMPARUTYADI KERATAILAM | $1.8K | 1 |
| KUNKUMADI TAILAM | $1.2K | 1 |
| TRIPHALADI TAILAM | $1.0K | 1 |
| KARPASASTHYADI TAILAM | $972 | 1 |
| KOTTAMCHUKKADI TAILAM | $914 | 1 |
| Kshirabala Tailam | $875 | 1 |
| GANDHARVAHASTADI ERANDATAILAM | $851 | 1 |
Flymax Exports & Imports exports 17 distinct Taila formulations including tablets, capsules, syrups, and combination drugs. The top formulation is MAHA NARAYANA TAILAM with 1 shipments worth $32.3K.
How Does Flymax Exports & Imports Compare to Nearest Taila Exporters?
Exporters ranked immediately above and below #9 by export value
| # | Supplier | Export Value | Shipments | Countries | Avg/Shipment |
|---|---|---|---|---|---|
| 7 | SANIYA EXPORTS & IMPORTS | $108.6K | 203 | 1 | $535 |
| 8 | ASHTANGA VAIDYAM AYURVEDICS | $106.5K | 326 | 5 | $327 |
| 9 | FLYMAX EXPORTS & IMPORTS ★ | $80.7K | 17 | 2 | $4.7K |
| 10 | COMBITIC GLOBAL CAPLET PRIVATE LIMITED | $78.4K | 147 | 2 | $533 |
| 11 | CHANDANA AYURVEDIC | $70.2K | 340 | 1 | $207 |
Flymax Exports & Imports ranks #9 among 208 Indian Taila exporters. Average shipment value of $4.7K compared to the market average of $30.9K. The closest competitors by value are SANIYA EXPORTS & IMPORTS and ASHTANGA VAIDYAM AYURVEDICS.
Which Indian Ports Ship Taila Exports?
| Port | Shipments | % Share |
|---|---|---|
| COCHIN SEA (INCOK1) | 1,341 | 19.2% |
| COCHIN SEA | 1,181 | 16.9% |
| TUTICORIN SEA | 533 | 7.6% |
| TUTICORIN SEA (INTUT1) | 529 | 7.6% |
| Cochin Sea | 349 | 5.0% |
| CHENNAI SEA (INMAA1) | 295 | 4.2% |
| DELHI AIR CARGO ACC (INDEL4) | 293 | 4.2% |
| Tuticorin Sea | 250 | 3.6% |
Market Intelligence
Latest developments and market context
Detailed market intelligence for Taila — including regulatory updates, trade policy changes, and competitive landscape analysis — will be available in an upcoming update. This section will feature AI-researched insights from verified industry sources, government notifications, and market reports.
Official References & Regulatory Resources
- CDSCO India
- Pharmexcil
- IBEF — India Pharma Industry
- Ministry of Commerce — Pharma Exports
- India Trade Statistics (DGFT)
Verify manufacturer licensing and export certifications with the official agencies above.
Research Methodology & Data Transparency
Suresh Sormare
Verified AuthorPharmaceutical Export-Import Analyst & Trade Intelligence Expert
Suresh Sormare is a pharmaceutical export-import analyst with deep expertise in Indian Customs (DGFT) data, HS code classification, and global pharmaceutical supply chains. His analysis covers 10M+ shipment records across 150+ countries and is used by manufacturers, procurement agencies, and trade consultants worldwide. Suresh specializes in identifying verified suppliers and buyers from customs records, mapping bilateral pharmaceutical trade corridors, analyzing tariff structures and regulatory frameworks across 170+ destination markets, and benchmarking competitive positioning for finished pharmaceutical formulations. His methodology combines granular customs transaction data with regulatory intelligence from FDA, EMA, WHO, CDSCO, and 40+ national drug authorities to deliver actionable trade insights for the pharmaceutical formulations sector.
linkedin.com/in/sureshsormarePrimary Data Source
All trade data is sourced from Indian Customs (DGFT) official shipping bill records — the authoritative government database for India's pharmaceutical trade. Each verified record contains exporter name, consignee (buyer) name, detailed product description, quantity, declared FOB value (USD), port of loading, destination country, and shipment date.
Analysis Methodology
- 1.Product Matching: Taila shipments identified using fuzzy matching on DGFT product description fields, validated against Indian Pharmacopoeia nomenclature.
- 2.Supplier Identification: Flymax Exports & Imports matched across shipments using name normalization, accounting for company name formatting variations.
- 3.Statistical Normalization: Shipment values are statistically normalized to ensure accurate market share representation. This removes the impact of unusually large one-off transactions that could distort company rankings.
- 4.Verified Records: This page is backed by 17 individual customs records matching Flymax Exports & Imports exporting Taila, covering 17 formulations to 2 countries via 2 buyers.
Government-Sourced Data
Official DGFT customs records
Transparent Methodology
Calculations fully disclosed above
Global Coverage
Exports to 82+ countries, 381+ buyers
Expert-Reviewed
Analyzed by pharmaceutical trade specialists
Get Taila Export Data from Flymax Exports & Imports
Access shipment-level details, pricing data, buyer connections, and competitive analysis for Flymax Exports & Imports's Taila exports. TransData Nexus provides verified Indian Customs (DGFT) data trusted by pharmaceutical trade professionals worldwide.
Flymax Exports & Imports
Company Profile
0 products · $0 total trade · 0 categories
Taila Stats
Related Analysis
Need Detailed Export Data?
Access shipment-level records, pricing trends, and buyer contacts for Flymax Exports & Imports.
Request DemoView Pricing →Data Source
Trade data sourced from Indian Customs (DGFT) export shipment records. Values represent FOB export value in USD. Market share calculated relative to total Indian pharmaceutical exports for Taila. For current shipment-level data, contact TransData Nexus.