United States to India: Ras Import Trade Route
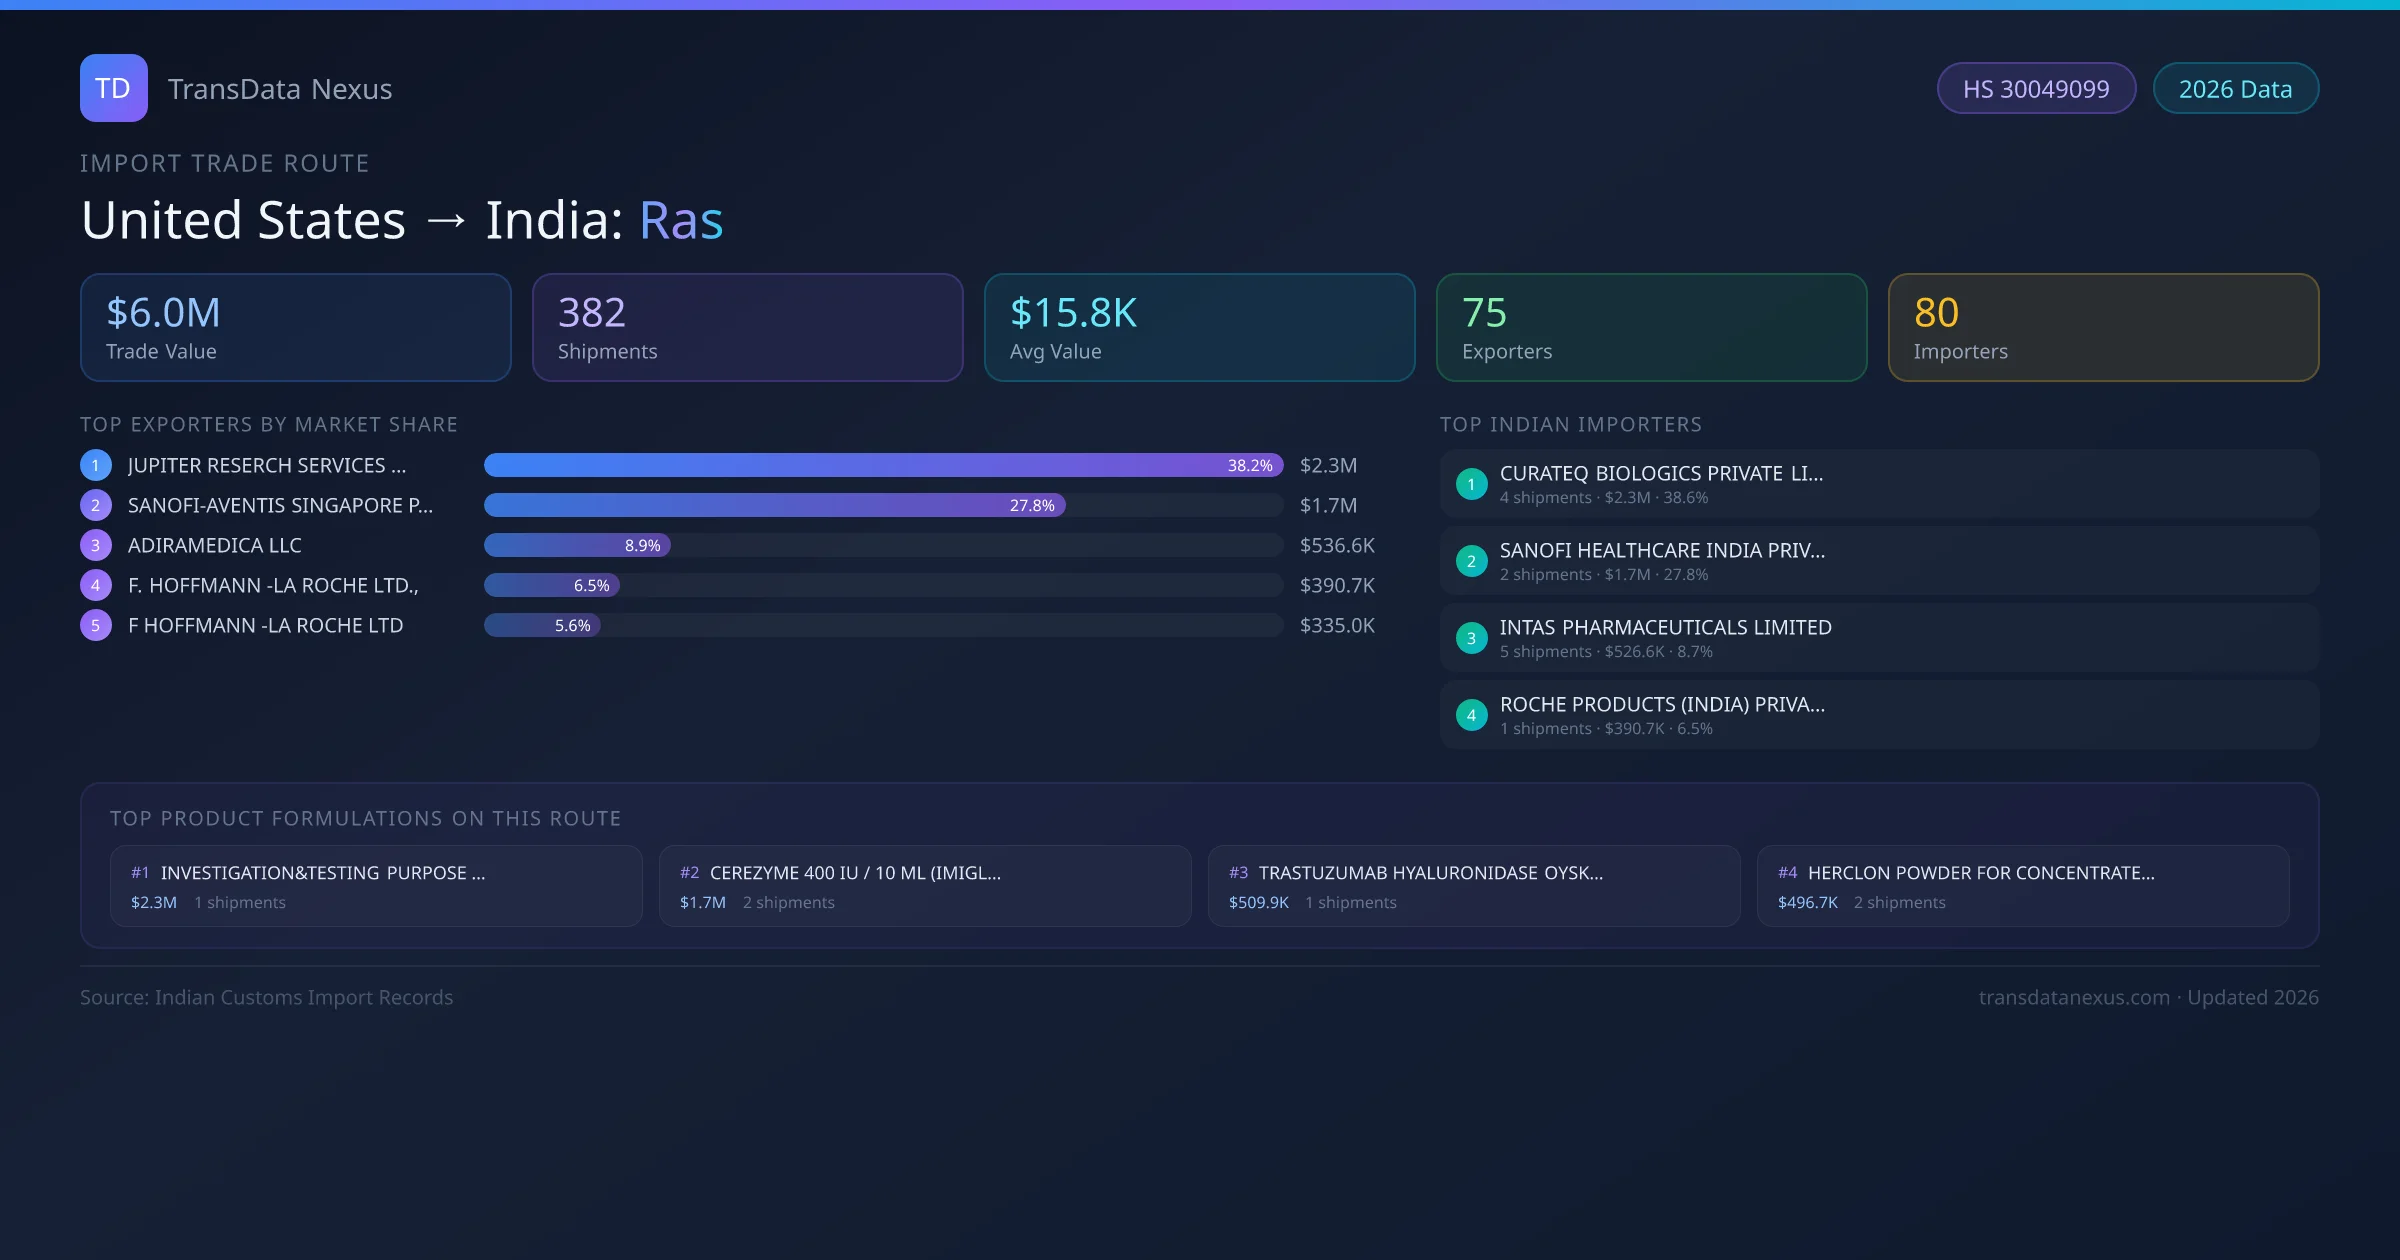
India has recorded 382 verified shipments of Ras imported from United States, representing a combined trade value of $6.0M USD. This corridor is served by 75 active United States exporters, with an average shipment value of $15.8K USD. The leading United States supplier is JUPITER RESERCH SERVICES INC, which accounts for 38% of total import value with 1 shipments worth $2.3M USD. On the buying side, CURATEQ BIOLOGICS PRIVATE LIMITED is the largest Indian importer with $2.3M USD in purchases. The top 3 suppliers — JUPITER RESERCH SERVICES INC, SANOFI-AVENTIS SINGAPORE PTE LTD, ADIRAMEDICA LLC — together control 75% of total trade value on this route. All data sourced from Indian Customs (DGFT) shipping bill of entry records. Values reported in FOB USD.
Route Intelligence Overview
The United States to India Ras corridor is one of India's established pharmaceutical import routes from United States, with 382 shipments documented worth a combined $6.0M USD. The route is dominated by JUPITER RESERCH SERVICES INC, which alone accounts for roughly 38% of all import value, reflecting the consolidated nature of United States's ras export sector.
Across 75 active United States suppliers, the average shipment value stands at $15.8K USD — a figure that reflects both bulk commercial orders from large pharmaceutical companies and smaller specialty shipments. Sea freight dominates at 76% of all shipments, consistent with ras's non-urgent bulk-order profile.
Shipment activity peaks during January–March, with an average transit time of 19 days port-to-port. The route has recorded an annual growth rate of 14.5%, placing it at rank #6 among India's top ras import origins globally.
On the Indian buyer side, key Indian importers include CURATEQ BIOLOGICS PRIVATE LIMITED, SANOFI HEALTHCARE INDIA PRIVATE LIMITED, INTAS PHARMACEUTICALS LIMITED and 77 others. CURATEQ BIOLOGICS PRIVATE LIMITED is the single largest Indian importer with 4 shipments valued at $2.3M USD.
Route Characteristics
- Average transit19 days
- Peak seasonQ1
- Primary modeSea freight
- Top port of entrySAHAR AIR CARGO ACC (INBOM4)
Market Position
- Global rank#6
- Annual growth+14.5%
- Demand growth+14.5%
- Regulatory ease78/100
Top 10 Ras Exporters from United States to India
Showing top 10 of 75 United States suppliers exporting Ras to India, ranked by total trade value (USD)
| Rank | Supplier (United States Exporter) | Shipments | Total Value (USD) | Market Share |
|---|---|---|---|---|
| 1 | JUPITER RESERCH SERVICES INC Avg $2.3M per shipment | 1 | $2.3M | 38.2% |
| 2 | SANOFI-AVENTIS SINGAPORE PTE LTD Avg $836.7K per shipment | 2 | $1.7M | 27.8% |
| 3 | ADIRAMEDICA LLC Avg $107.3K per shipment | 5 | $536.6K | 8.9% |
| 4 | F. HOFFMANN -LA ROCHE LTD., Avg $390.7K per shipment | 1 | $390.7K | 6.5% |
| 5 | F HOFFMANN -LA ROCHE LTD Avg $335.0K per shipment | 1 | $335.0K | 5.6% |
| 6 | NEWLIFE MEDICALS USA INC Avg $31.1K per shipment | 6 | $186.4K | 3.1% |
| 7 | F HOFFMANN -LA ROCHE LIMITED Avg $161.8K per shipment | 1 | $161.8K | 2.7% |
| 8 | Espee Biopharma & Finechem LLC Avg $11.7K per shipment | 5 | $58.4K | 1.0% |
| 9 | ESPEE BIOPHARMA & FINECHEM LLC Avg $9.6K per shipment | 6 | $57.6K | 1.0% |
| 10 | WORTHAM LABORATORIES INC. Avg $54.4K per shipment | 1 | $54.4K | 0.9% |
This table shows the top 10 of 75 United States companies exporting ras to India, ranked by total trade value. The listed exporters are: JUPITER RESERCH SERVICES INC, SANOFI-AVENTIS SINGAPORE PTE LTD, ADIRAMEDICA LLC, F. HOFFMANN -LA ROCHE LTD.,, F HOFFMANN -LA ROCHE LTD, NEWLIFE MEDICALS USA INC, F HOFFMANN -LA ROCHE LIMITED, Espee Biopharma & Finechem LLC, ESPEE BIOPHARMA & FINECHEM LLC, WORTHAM LABORATORIES INC.. JUPITER RESERCH SERVICES INC is the dominant supplier with 1 shipments worth $2.3M USD, giving it a 38% market share. The top 3 suppliers together account for 75% of the total trade value on this route.
Showing top 10 of 75 total United States exporters on the United States to India Ras import route.
Top 10 Indian Ras Importers from United States
Showing top 10 of 80 known Indian buyers receiving Ras shipments from United States, ranked by import value
On the receiving end of this trade route, the leading Indian importers of United States ras include CURATEQ BIOLOGICS PRIVATE LIMITED, SANOFI HEALTHCARE INDIA PRIVATE LIMITED, INTAS PHARMACEUTICALS LIMITED, ROCHE PRODUCTS (INDIA) PRIVATE LIMITED, ROCHE PRODUCTS I PVT LTD, among 80 total buyers. The largest importer is CURATEQ BIOLOGICS PRIVATE LIMITED, accounting for $2.3M USD across 4 shipments — representing 39% of all ras imports from United States on this route.
| Rank | Indian Importer / Buyer | Shipments | Import Value (USD) | Market Share |
|---|---|---|---|---|
| 1 | CURATEQ BIOLOGICS PRIVATE LIMITED | 4 | $2.3M | 38.6% |
| 2 | SANOFI HEALTHCARE INDIA PRIVATE LIMITED | 2 | $1.7M | 27.8% |
| 3 | INTAS PHARMACEUTICALS LIMITED | 5 | $526.6K | 8.7% |
| 4 | ROCHE PRODUCTS (INDIA) PRIVATE LIMITED | 1 | $390.7K | 6.5% |
| 5 | ROCHE PRODUCTS I PVT LTD | 1 | $335.0K | 5.6% |
| 6 | ROCHE PRODUCTS I PRIVATE LIMITED | 1 | $161.8K | 2.7% |
| 7 | SAMARTH LIFE SCIENCES PRIVATE LIMITED | 1 | $127.5K | 2.1% |
| 8 | SWASTH KARE | 1 | $54.4K | 0.9% |
| 9 | DR.REDDY'S LABORATORIES LTD | 4 | $49.1K | 0.8% |
| 10 | HETERO LABS LIMITED | 2 | $45.6K | 0.8% |
Showing top 10 of 80 Indian Ras importers from United States on this route.
Top 10 Ras Formulations Imported from United States
Showing top 10 of 348 product formulations shipped on the United States to India Ras route, ranked by trade value
India imports a wide range of ras formulations from United States, spanning tablets, capsules, suspensions, and combination drugs. The top formulation — INVESTIGATION&TESTING PURPOSE ONLY-PEGFILGRASTIM INJECTON (NEULASTA)6MG/0.6ML (QTY:350 NOS) ASPER INVPEGFILGRASTIM INJECTON (NEULASTA)6MG/0.6ML (QTY:350 NOS) AS — accounts for $2.3M USD across 1 shipments. There are 348 distinct product descriptions in the dataset, reflecting the variety of dosage forms and strengths imported.
| Rank | Product Formulation | Shipments | Trade Value (USD) | Market Share |
|---|---|---|---|---|
| 1 | INVESTIGATION&TESTING PURPOSE ONLY-PEGFILGRASTIM INJECTON (NEULASTA)6MG/0.6ML (QTY:350 NOS) ASPER INVPEGFILGRASTIM INJECTON (NEULASTA)6MG/0.6ML (QTY:350 NOS) AS | 1 | $2.3M | 38.2% |
| 2 | CEREZYME 400 IU / 10 ML (IMIGLUCERASE FOR INJECTION) (LIST 3SR. NO. 106)(PAC) | 2 | $1.7M | 27.8% |
| 3 | TRASTUZUMAB HYALURONIDASE OYSK INJECTION FOR SUBCUTANEOUSE USE HERCEPTIN HYLECTA 600MG TRASTUZUMAB 10 000 UNITS HYATRASTUZUMAB HYALURONIDASE OYSK INJECTION FOR SUBCUTANEOUS | 1 | $509.9K | 8.5% |
| 4 | HERCLON POWDER FOR CONCENTRATE FOR SOLUTION FOR INFUSION 440MG VIAL 1 TRASTUZUMABMONOCLONAL ANTIBODYPACLIFE SAVIN | 2 | $496.7K | 8.3% |
| 5 | HERCLON POWDER FOR CONCENTRATE FOR SOLUTION FOR INFUSION 440MG VIAL 1 (TRASTUZUMAB)(MONOCLONAL ANTIBODY)(PAC)(LIFE SAVIN | 1 | $390.7K | 6.5% |
| 6 | FILGRASTIM NEUPOGEN 300MCG 0 5ML IN PFS ITEM CODE FG04154 PACK SIZE 10S X 36 FILGRASTIM NEUPOGEN 300MCG 0 5ML IN PFS ITEM CODE FG04154 | 1 | $127.5K | 2.1% |
| 7 | SERASEAL,3 ML VIAL (4003-1-B) (HEMOSTATIC AGENT) (LIFE SAVING DRUG) (LIST NO.4 S.NO.92SERASEAL | 1 | $54.4K | 0.9% |
| 8 | HERCEPTIN HYLECTA VIAL TRASTUZUMAB AND HYALURONIDASE INJECTION 6 PACK X 1 VIAL = 6 VIALDSIR NO TU/IV-RD/2638/2023 | 1 | $31.0K | 0.5% |
| 9 | NEULASTA ONPRO KIT 6MG PFS PEGFILGRASTIM 6MG/0.6ML IN SINGLE DOSE PREFILLED SYRINGE CO-PACKAGED WITH ON-BODY INJECTOR | 1 | $27.9K | 0.5% |
| 10 | KRAZATI ADAGRASIB TABLET COATED 200 MG PACK SIZE 1 IN 1CARTON 180 IN 1 BOTTLE TABLETS FOR TEST ANALYSIS PURPOSE | 1 | $23.9K | 0.4% |
Showing top 10 of 348 Ras formulations imported from United States on this route.
Shipping & Logistics Analysis
Freight mode split and port-of-origin breakdown
Freight Mode Distribution
Sea freight dominates at 76%, typical for bulk pharmaceutical shipments.
Top Indian Ports of Entry
SAHAR AIR CARGO ACC (INBOM4) handles the highest volume with 124 shipments. Transit time averages 19 days by sea.
Market Dynamics
India's ras imports from United States are driven primarily by a handful of large-scale United States manufacturers. JUPITER RESERCH SERVICES INC with 1 shipments leads the pack, a pattern common in generic pharmaceutical corridors where manufacturing scale creates significant cost advantages. The presence of 75 active exporters signals a competitive but concentrated market — Indian buyers benefit from United States supplier diversity while the top tier handles the majority of volume.
The top 3 suppliers — JUPITER RESERCH SERVICES INC, SANOFI-AVENTIS SINGAPORE PTE LTD, ADIRAMEDICA LLC — together account for 75% of total trade value on this route. The average shipment value of $15.8K USD reflects a mix of bulk commercial orders and smaller specialty shipments.
Beyond the primary product category, shipments on this route include closely related formulations such as cerezyme 400 iu / 10 ml (imiglucerase for injection) (list 3sr. no. 106)(pac) and trastuzumab hyaluronidase oysk injection for subcutaneouse use herceptin hylecta 600mg trastuzumab 10 000 units hyatrastuzumab hyaluronidase oysk injection for subcutaneous, suggesting that Indian buyers tend to consolidate orders across related product lines from the same United States supplier.
On the buying side, CURATEQ BIOLOGICS PRIVATE LIMITED is the largest importer with 4 shipments worth $2.3M USD — representing 39% of all ras imports from United States on this route. A total of 80 buyers are active on this corridor.
Route Statistics
- Trade Volume
- $6.0M
- Avg. Shipment
- $15.8K
- Suppliers
- 75
- Buyers
- 80
- Transit (Sea)
- ~19 days
- Annual Growth
- +14.5%
Related Analysis
Reverse Direction
India → United States — Ras (Export)Unlock the Full United States to India Ras Dataset
TransData Nexus provides verified shipment-level records, exporter contact details, HS code breakdowns, real-time pricing benchmarks, and regulatory compliance guides for 382 shipments on this route.
Frequently Asked Questions — United States to India Ras Trade
Answers based on Indian Customs (DGFT) shipment records compiled by TransData Nexus
Q Which United States companies export Ras to India?
The leading United States exporters of Ras to India are JUPITER RESERCH SERVICES INC, SANOFI-AVENTIS SINGAPORE PTE LTD, ADIRAMEDICA LLC. JUPITER RESERCH SERVICES INC holds the largest market share at approximately 38% of total trade value on this route.
Q What is the total value of Ras imports from United States to India?
India imports Ras from United States worth approximately $6.0M USD across 382 recorded shipments. The average value per shipment is $15.8K USD.
Q Which Indian ports receive Ras from United States?
The most active Indian port of entry is SAHAR AIR CARGO ACC (INBOM4) with 124 shipments. United States exporters primarily use sea freight for this route, with 76% of shipments going by sea and 23% by air.
Q How long does shipping take from United States to India for Ras?
The average transit time for Ras shipments from United States to India is approximately 19 days. Sea freight typically takes longer, while air freight can reduce this significantly for urgent orders. Peak shipping activity is observed during January–March.
Q Is the United States to India Ras import route growing?
Yes — this trade corridor has seen an annual growth rate of approximately 14.5% with demand growth tracking at 14.5%. The route is ranked #6 among India's top Ras import origins globally.
Q How many United States suppliers are active on this Ras import route?
There are currently 75 active United States suppliers exporting Ras to India. The market is moderately concentrated with JUPITER RESERCH SERVICES INC accounting for 38% of total shipment value.
Q Who are the main Indian importers of Ras from United States?
The leading Indian importers of Ras from United States include CURATEQ BIOLOGICS PRIVATE LIMITED, SANOFI HEALTHCARE INDIA PRIVATE LIMITED, INTAS PHARMACEUTICALS LIMITED, ROCHE PRODUCTS (INDIA) PRIVATE LIMITED, ROCHE PRODUCTS I PVT LTD. CURATEQ BIOLOGICS PRIVATE LIMITED is the largest buyer with 4 shipments worth $2.3M USD.
Official References & Regulatory Resources
- India Trade Statistics (DGFT)
- Invest India — Pharma Sector
- WCO HS Nomenclature
- Ministry of Commerce — Pharma Exports
- Pharmexcil
Data sourced from Indian Customs (DGFT) records. Verify regulatory and trade status with the agencies above.
Research Methodology & Data Transparency
Suresh Sormare
Verified AuthorPharmaceutical Export-Import Analyst & Trade Intelligence Expert
Suresh Sormare is a pharmaceutical export-import analyst with deep expertise in Indian Customs (DGFT) data, HS code classification, and global pharmaceutical supply chains. His analysis covers 10M+ shipment records across 150+ countries and is used by manufacturers, procurement agencies, and trade consultants worldwide. Suresh specializes in identifying verified suppliers and buyers from customs records, mapping bilateral pharmaceutical trade corridors, analyzing tariff structures and regulatory frameworks across 170+ destination markets, and benchmarking competitive positioning for finished pharmaceutical formulations. His methodology combines granular customs transaction data with regulatory intelligence from FDA, EMA, WHO, CDSCO, and 40+ national drug authorities to deliver actionable trade insights for the pharmaceutical formulations sector.
linkedin.com/in/sureshsormarePrimary Data Source
All trade data is sourced from Indian Customs (DGFT) official shipping bill records — the authoritative government database for India's pharmaceutical trade. Each verified record contains exporter name, consignee (buyer) name, detailed product description, quantity, declared FOB value (USD), port of loading, destination country, and shipment date.
Analysis Methodology
- 1.Route Identification: India to United States export trade corridor identified from Indian Customs (DGFT) records for Ras.
- 2.Supplier/Buyer Matching: 75 Indian exporters and 80 importers in United States matched using name normalization.
- 3.Value Aggregation: Total export value aggregated from 382 verified shipping bill records. Values are FOB in USD.
- 4.Market Share Analysis: Each supplier and buyer contribution calculated as a percentage of total route value. Statistical normalization applied to ensure accurate representation across varying shipment sizes.
Government-Sourced Data
Official DGFT customs records
Transparent Methodology
Calculations fully disclosed above
382 Verified Shipments
75 Indian exporters tracked
Expert-Reviewed
By pharmaceutical trade specialists