Who Buys Plasma from India — 740 Importers Behind a $2.8M Market
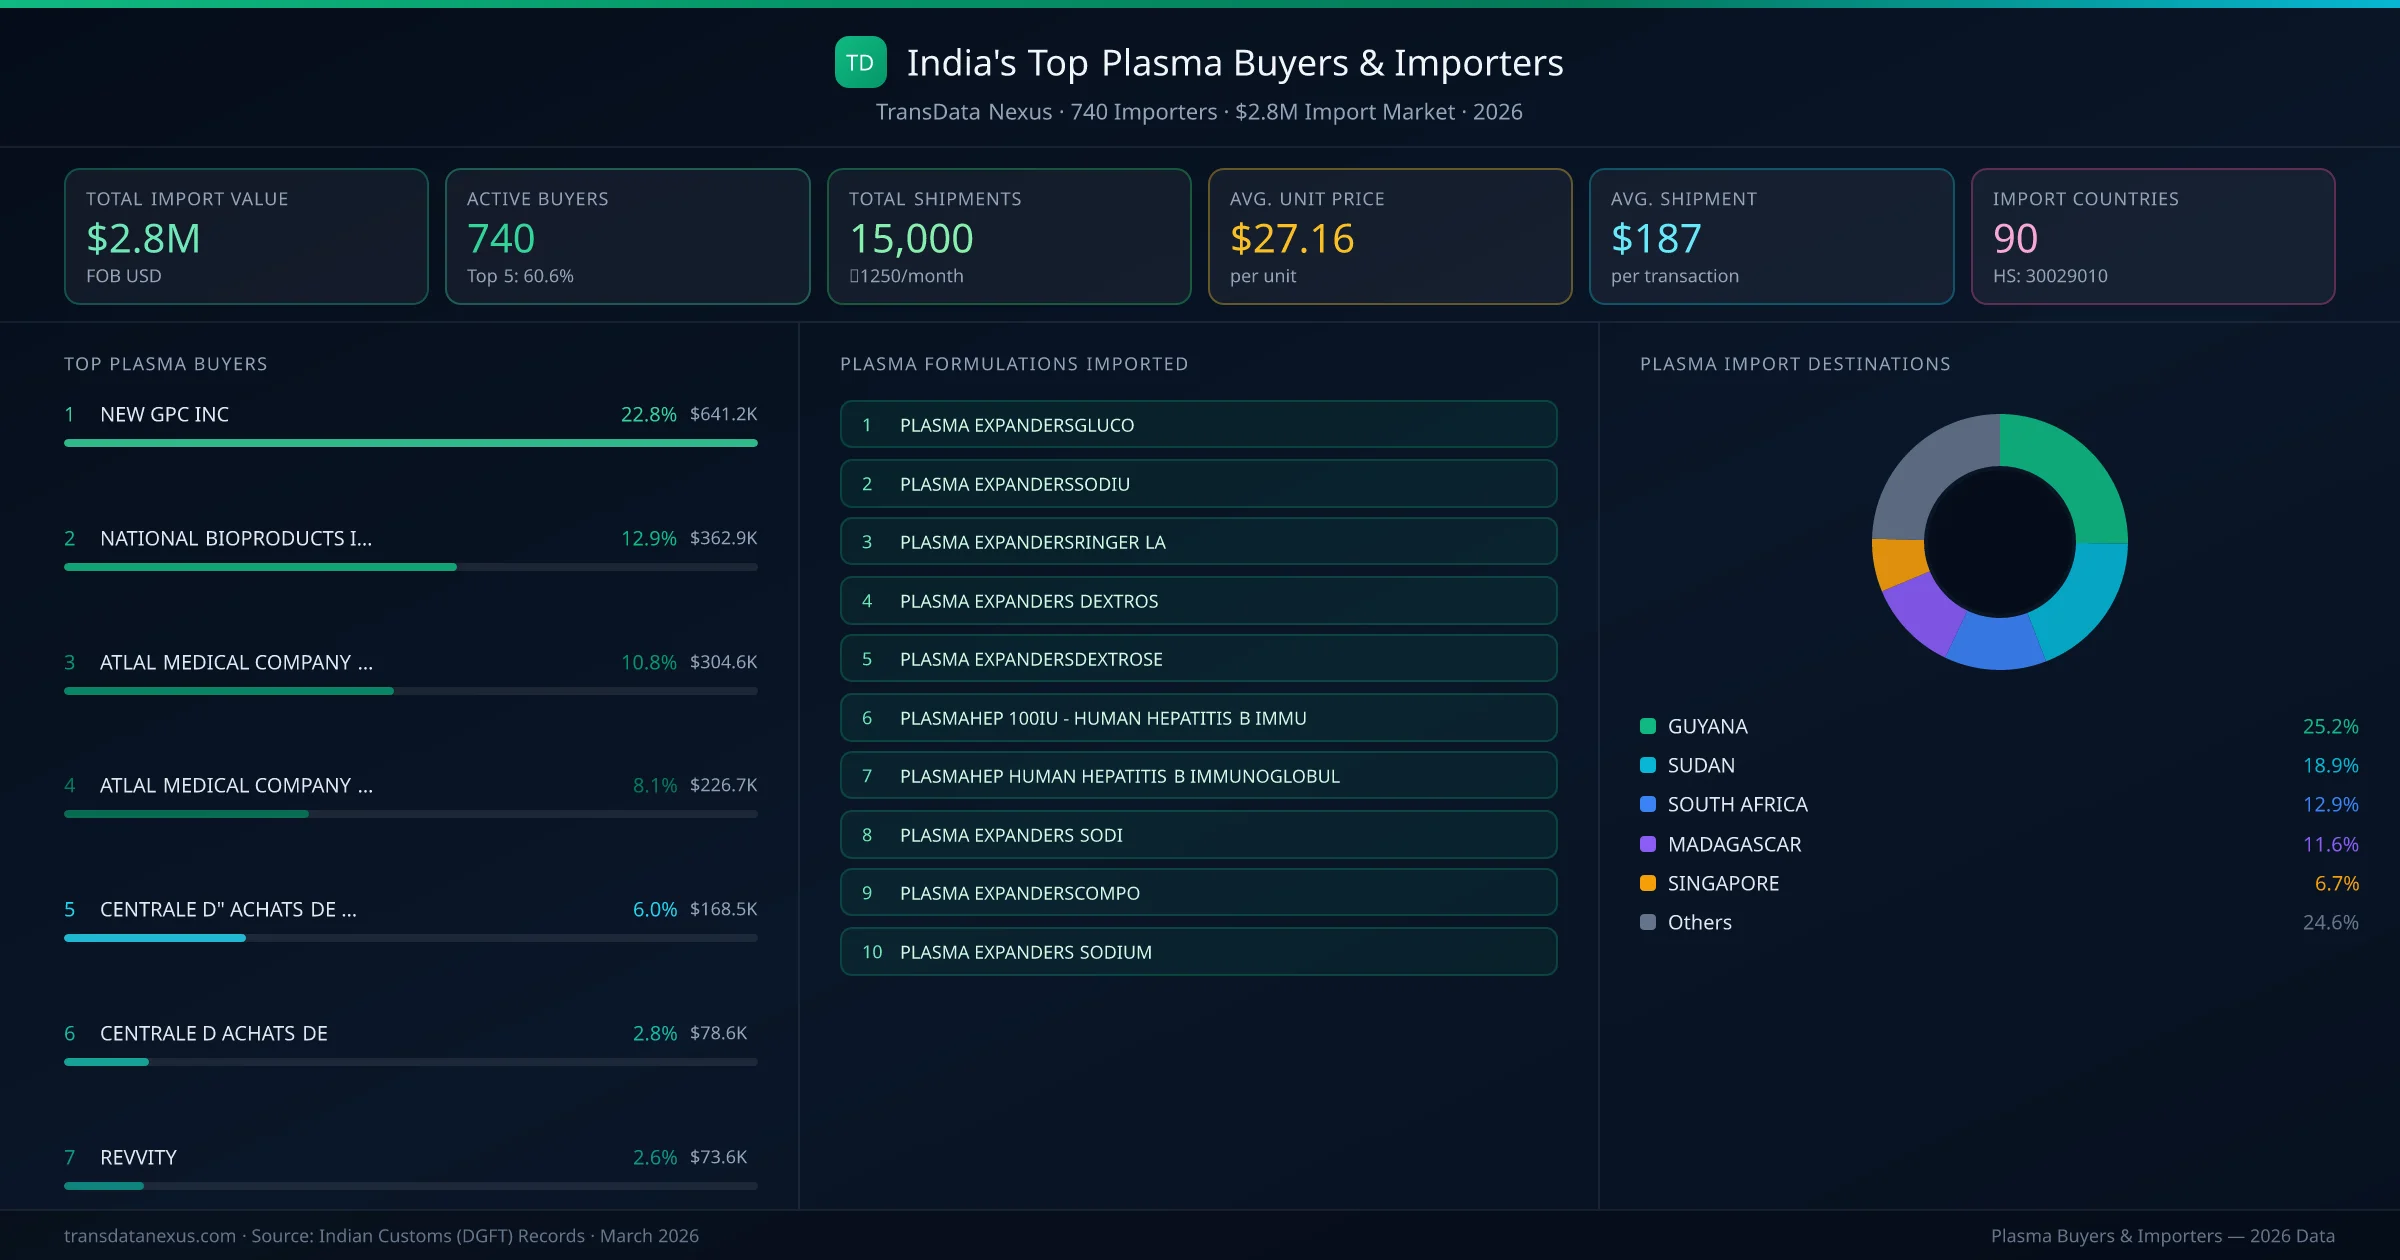
India's plasma import market is served by 740 active buyers who collectively imported $2.8M across 15,000 shipments. NEW GPC INC (GUYANA) leads with a 22.8% market share, followed by ATLAL MEDICAL COMPANY LTD and ATLAL MEDICAL COMPANY LIMITED. The top 5 buyers together control 50.5% of total import value, reflecting a moderately competitive buyer landscape.
Top Plasma Importers — Ranked by Import Value
NEW GPC INC (GUYANA) is the leading plasma importer from India, holding a 22.8% share of the $2.8M market across 15,000 shipments from 740 buyers. The top 5 buyers — NEW GPC INC (GUYANA), ATLAL MEDICAL COMPANY LTD (SUDAN), ATLAL MEDICAL COMPANY LIMITED (SUDAN), CENTRALE D" ACHATS DE MEDICAMENTS (MADAGASCAR), CENTRALE D ACHATS DE (MADAGASCAR) — collectively control 50.5% of total import value.
Top Plasma Buyers & Importers
Ranked by import value · 740 active buyers · Indian Customs (DGFT) data
| # | Buyer & Formulations | Value | Suppliers | Share |
|---|---|---|---|---|
| 1 | NEW GPC INCGUYANA PLASMA EXPANDERSGLUCOPLASMAHEP 100IU - HUMAN HEPATITIS B IMMUHBSAG POSTIVE PLASMA - LOT # KB156156 | $641.2K | 5 | 22.8% |
| 2 | ATLAL MEDICAL COMPANY LTDSUDAN | $304.6K | 5 | 10.8% |
| 3 | ATLAL MEDICAL COMPANY LIMITEDSUDAN | $226.7K | 5 | 8.1% |
| 4 | CENTRALE D" ACHATS DE MEDICAMENTSMADAGASCAR PLASMA EXPANDERSRINGER LAPLASMA EXPANDERS DEXTROSPLASMA EXPANDERSDEXTROSE | $168.5K | 5 | 6.0% |
| 5 | CENTRALE D ACHATS DEMADAGASCAR PLASMA EXPANDERSRINGER LAPLASMA EXPANDERS DEXTROSPLASMA EXPANDERSDEXTROSE | $78.6K | 5 | 2.8% |
| 6 | REVVITYFINLAND PREGNANCY ASSOCIATED PLASMA PROTEIN A ANTIGENPREGNANCY ASSOCIATED PLASMA PROTIEN A (PHUMAN PLASMA SAMPLES - FORTESTING PURPOSE ONLYNOS | $73.6K | 5 | 2.6% |
| 7 | MP BIOMEDICALS ASIA PACIFIC PTE LTDSINGAPORE PLASMAHEP HUMAN HEPATITIS B IMMUNOGLOBULHBSAG POSTIVE PLASMA - LOT # KB156156HBSAG POSTIVE PLASMA - LOT # KB156157 | $51.6K | 5 | 1.8% |
| 8 | CENTRALE DACHATS DE MEDICAMENTSMADAGASCAR PLASMA EXPANDERSRINGER LAPLASMA EXPANDERS DEXTROSPLASMA EXPANDERSDEXTROSE | $46.6K | 5 | 1.7% |
| 9 | MEDETHIX INCORPORATEDPHILIPPINES RAPID TEST KIT- DENGUE ONSETPLASMABLOC75MG FILM COATED TABLETS) | $46.2K | 5 | 1.6% |
| 10 | MP BIOMEDICALS ASIA PACIFIC PTE LIMITEDSINGAPORE PLASMAHEP HUMAN HEPATITIS B IMMUNOGLOBULHBSAG POSTIVE PLASMA - LOT # KB156156HBSAG POSTIVE PLASMA - LOT # KB156157 | $36.9K | 5 | 1.3% |
| 11 | THERMO FISHER SCIENTIFICUNITED STATES | $36.7K | 5 | 1.3% |
| 12 | QUEENS ATLANTIC INDUSTRIALGUYANA PLASMA EXPANDERSGLUCO | $33.5K | 5 | 1.2% |
| 13 | NEW GPC INC.GUYANA PLASMA EXPANDERSGLUCOPLASMAHEP 100IU - HUMAN HEPATITIS B IMMUHBSAG POSTIVE PLASMA - LOT # KB156156 | $33.5K | 5 | 1.2% |
| 14 | CENTRALE D'ACHATS DE MEDICAMENTSMADAGASCAR PLASMA EXPANDERSRINGER LAPLASMA EXPANDERS DEXTROSPLASMA EXPANDERSDEXTROSE | $33.4K | 5 | 1.2% |
| 15 | INDIVUMED SERVICES GMBHGERMANY FROZEN HUMAN PLASMA IN EPPENDORF TUBE (F | $33.1K | 5 | 1.2% |
Related Analysis
Market Analysis: Top Importing Countries & Importers
Comprehensive geographic market intelligence dashboard
Which companies are buying Plasma — and from which countries?
Flow of Plasma exports from India: each country's share and the named importers behind the numbers
Plasma — Buyer Countries to Key Importers
Trade flow: top importing countries → named buyer companies

Market Analysis: Top Importing Countries & Their Importers
1Guyana
Guyana emerges as the first largest importing country, achieving a total trade value of $708.3K through 116 shipments. This represents a market share of 25.2% of the total market activity, demonstrating their significant presence in the industry.
Top Importers: Guyana has a diverse importer base, with their top importers including:
• NEW GPC INC - $641.2K (90.5% of country's total business)
• QUEENS ATLANTIC INDUSTRIAL - $33.5K (4.7% of country's total business)
• NEW GPC INC. - $33.5K (4.7% of country's total business)
Key Insight: Guyana demonstrates strong market positioning with an average shipment value of $6.1K, indicating premium pricing strategy compared to the market average of $187.
Guyana is a key market for Plasma imports, representing 25.2% of total trade value.
2Sudan
Sudan emerges as the second largest importing country, achieving a total trade value of $532.1K through 75 shipments. This represents a market share of 18.9% of the total market activity, demonstrating their significant presence in the industry.
Top Importers: Sudan has a diverse importer base, with their top importers including:
• ATLAL MEDICAL COMPANY LTD - $304.6K (57.2% of country's total business)
• ATLAL MEDICAL COMPANY LIMITED - $226.7K (42.6% of country's total business)
Key Insight: Sudan demonstrates strong market positioning with an average shipment value of $7.1K, indicating premium pricing strategy compared to the market average of $187.
Sudan is a key market for Plasma imports, representing 18.9% of total trade value.
3South Africa
South Africa emerges as the third largest importing country, achieving a total trade value of $363.2K through 0 shipments. This represents a market share of 12.9% of the total market activity, demonstrating their significant presence in the industry.
Key Insight: South Africa demonstrates strong market positioning with an average shipment value of $363.2K, indicating premium pricing strategy compared to the market average of $187.
South Africa is a key market for Plasma imports, representing 12.9% of total trade value.
4Madagascar
Madagascar emerges as the fourth largest importing country, achieving a total trade value of $327.3K through 26 shipments. This represents a market share of 11.6% of the total market activity, demonstrating their significant presence in the industry.
Top Importers: Madagascar has a diverse importer base, with their top importers including:
• CENTRALE D" ACHATS DE MEDICAMENTS - $168.5K (51.5% of country's total business)
• CENTRALE D ACHATS DE - $78.6K (24.0% of country's total business)
• CENTRALE DACHATS DE MEDICAMENTS - $46.6K (14.2% of country's total business)
• CENTRALE D'ACHATS DE MEDICAMENTS - $33.4K (10.2% of country's total business)
Key Insight: Madagascar demonstrates strong market positioning with an average shipment value of $12.6K, indicating premium pricing strategy compared to the market average of $187.
Madagascar is a key market for Plasma imports, representing 11.6% of total trade value.
5Singapore
Singapore emerges as the fifth largest importing country, achieving a total trade value of $188.2K through 2,362 shipments. This represents a market share of 6.7% of the total market activity, demonstrating their significant presence in the industry.
Top Importers: Singapore has a diverse importer base, with their top importers including:
• MP BIOMEDICALS ASIA PACIFIC PTE LTD - $51.6K (27.4% of country's total business)
• MP BIOMEDICALS ASIA PACIFIC PTE LIMITED - $36.9K (19.6% of country's total business)
• LABCORP DEVELOPMENT ASIA PTE LIMITE - $20.8K (11.0% of country's total business)
Key Insight: Singapore demonstrates strong market positioning with an average shipment value of $80, indicating competitive pricing strategy compared to the market average of $187.
Singapore is a key market for Plasma imports, representing 6.7% of total trade value.
Buyer Segment Analysis
TransData Nexus Plasma buyer market intelligence
1Buyer Segment Analysis
The 740 buyers of Indian plasma can be categorized into several segments:
1. Distributors: Entities that purchase plasma to supply to various healthcare providers.
2. Government Procurement Agencies: Organizations responsible for acquiring medical supplies for public health institutions.
3. Hospital Groups: Large healthcare networks that procure plasma directly for patient care.
4. Re-exporters: Companies that import plasma for the purpose of exporting to other markets.
Typical buying behaviors vary across these segments. Distributors and re-exporters often place frequent, smaller orders to maintain inventory levels and meet dynamic demand. Government agencies and hospital groups tend to engage in bulk purchasing through tenders or long-term contracts, ensuring a steady supply for public health needs. The repeat buyer rate of 46.4% indicates a significant level of ongoing demand and established relationships between Indian exporters and these buyers.
Country-Specific Import Regulations
TransData Nexus Plasma buyer market intelligence
1Country-Specific Import Regulations
Understanding the import regulations for plasma (HS Code 30029010) in the top five importing countries is crucial:
1. Guyana:
2. Sudan:
3. South Africa:
4. Madagascar:
5. Singapore:
Demand Drivers & Market Opportunity
TransData Nexus Plasma buyer market intelligence
1Demand Drivers & Market Opportunity
The demand for plasma in importing countries is driven by several factors:
1. Disease Prevalence: High incidences of conditions such as hemophilia, immune deficiencies, and liver diseases necessitate plasma-derived therapies. For instance, the World Federation of Hemophilia reported in 2025 that many developing countries have a significant unmet need for hemophilia treatment.
2. Government Healthcare Programs: Initiatives aimed at improving healthcare infrastructure and access, such as universal health coverage expansions, increase the demand for essential medicines, including plasma products.
3. WHO Essential Medicines List Procurement: Plasma-derived medicines are included in the WHO's Essential Medicines List, prompting countries to prioritize their procurement to meet public health needs.
4. Tender-Based Purchasing: Many governments and large healthcare organizations procure pharmaceuticals through tenders, ensuring a consistent supply of plasma products. The presence of 740 buyers across 90 countries indicates a broad and sustained demand, presenting significant market opportunities for Indian exporters.
In conclusion, the plasma import market from India is characterized by a diverse buyer landscape, stringent yet navigable import regulations, and robust demand drivers, offering substantial opportunities for growth and collaboration in the global healthcare sector.
Common Questions — Plasma Buyers & Importers
Answers based on Indian Customs (DGFT) shipment records compiled by TransData Nexus
QWho is the largest plasma buyer importing from India?
Based on import volume and value, NEW GPC INC (GUYANA) leads with $641.2K in imports and a 22.8% market share — the highest of any single plasma importer. ATLAL MEDICAL COMPANY LTD (SUDAN) and ATLAL MEDICAL COMPANY LIMITED (SUDAN) are the next largest buyers.
QHow many companies buy plasma from India?
There are 740 active plasma buyers importing from India, with a combined market of $2.8M across 15,000 shipments to 90 countries. The top 5 buyers hold 50.5% of total import value, while the remaining 735 buyers handle the other 49.5%.
QWhich countries import the most plasma from India?
The top importing countries for plasma from India are Guyana (25.2%), Sudan (18.9%), South Africa (12.9%), Madagascar (11.6%), Singapore (6.7%). These markets represent the largest demand centres for Indian pharmaceutical exports of plasma, with buyers ranging from government procurement agencies to private pharmaceutical distributors.
QWhat is the average import order value for plasma from India?
The average import transaction value for plasma from India is $187, with an average unit price of $27.16 per unit. Order sizes vary significantly based on buyer type — government tenders tend to be larger while private distributors place more frequent smaller orders.
Buyer Segment Analysis
TransData Nexus Plasma buyer market intelligence
1Buyer Segment Analysis
The 740 buyers of Indian plasma can be categorized into several segments:
1. Distributors: Entities that purchase plasma to supply to various healthcare providers.
2. Government Procurement Agencies: Organizations responsible for acquiring medical supplies for public health institutions.
3. Hospital Groups: Large healthcare networks that procure plasma directly for patient care.
4. Re-exporters: Companies that import plasma for the purpose of exporting to other markets.
Typical buying behaviors vary across these segments. Distributors and re-exporters often place frequent, smaller orders to maintain inventory levels and meet dynamic demand. Government agencies and hospital groups tend to engage in bulk purchasing through tenders or long-term contracts, ensuring a steady supply for public health needs. The repeat buyer rate of 46.4% indicates a significant level of ongoing demand and established relationships between Indian exporters and these buyers.
Country-Specific Import Regulations
TransData Nexus Plasma buyer market intelligence
1Country-Specific Import Regulations
Understanding the import regulations for plasma (HS Code 30029010) in the top five importing countries is crucial:
1. Guyana:
2. Sudan:
3. South Africa:
4. Madagascar:
5. Singapore:
Demand Drivers & Market Opportunity
TransData Nexus Plasma buyer market intelligence
1Demand Drivers & Market Opportunity
The demand for plasma in importing countries is driven by several factors:
1. Disease Prevalence: High incidences of conditions such as hemophilia, immune deficiencies, and liver diseases necessitate plasma-derived therapies. For instance, the World Federation of Hemophilia reported in 2025 that many developing countries have a significant unmet need for hemophilia treatment.
2. Government Healthcare Programs: Initiatives aimed at improving healthcare infrastructure and access, such as universal health coverage expansions, increase the demand for essential medicines, including plasma products.
3. WHO Essential Medicines List Procurement: Plasma-derived medicines are included in the WHO's Essential Medicines List, prompting countries to prioritize their procurement to meet public health needs.
4. Tender-Based Purchasing: Many governments and large healthcare organizations procure pharmaceuticals through tenders, ensuring a consistent supply of plasma products. The presence of 740 buyers across 90 countries indicates a broad and sustained demand, presenting significant market opportunities for Indian exporters.
In conclusion, the plasma import market from India is characterized by a diverse buyer landscape, stringent yet navigable import regulations, and robust demand drivers, offering substantial opportunities for growth and collaboration in the global healthcare sector.
Official References & Regulatory Resources
- European Medicines Agency
- WHO Essential Medicines
- Invest India — Pharma Sector
- India Trade Statistics (DGFT)
Verify import regulations and drug registration requirements with the official agencies above.
Research Methodology & Data Transparency
Suresh Sormare
Verified AuthorPharmaceutical Export-Import Analyst & Trade Intelligence Expert
Suresh Sormare is a pharmaceutical export-import analyst with deep expertise in Indian Customs (DGFT) data, HS code classification, and global pharmaceutical supply chains. His analysis covers 10M+ shipment records across 150+ countries and is used by manufacturers, procurement agencies, and trade consultants worldwide. Suresh specializes in identifying verified suppliers and buyers from customs records, mapping bilateral pharmaceutical trade corridors, analyzing tariff structures and regulatory frameworks across 170+ destination markets, and benchmarking competitive positioning for finished pharmaceutical formulations. His methodology combines granular customs transaction data with regulatory intelligence from FDA, EMA, WHO, CDSCO, and 40+ national drug authorities to deliver actionable trade insights for the pharmaceutical formulations sector.
linkedin.com/in/sureshsormarePrimary Data Source
All trade data is sourced from Indian Customs (DGFT) official shipping bill records — the authoritative government database for India's pharmaceutical trade. Each verified record contains exporter name, consignee (buyer) name, detailed product description, quantity, declared FOB value (USD), port of loading, destination country, and shipment date.
Analysis Methodology
- 1.Buyer Identification: 740 global importers of Plasma identified from consignee fields in DGFT shipping bill records.
- 2.Import Value Analysis: Total import value aggregated from 15,000 individual shipping bill records. Values are FOB in USD.
- 3.Statistical Normalization: Shipment values are statistically normalized to ensure accurate market share representation.
- 4.Geographic Distribution: Buyer imports distributed across 90 destination countries with market share per buyer calculated from capped values.
Government-Sourced Data
Official DGFT customs records
Transparent Methodology
Calculations fully disclosed above
15,000 Verified Shipments
740 buyers tracked
Expert-Reviewed
By pharmaceutical trade specialists