Who Buys Nilotinib from India — 56 Importers Behind a $1.2M Market
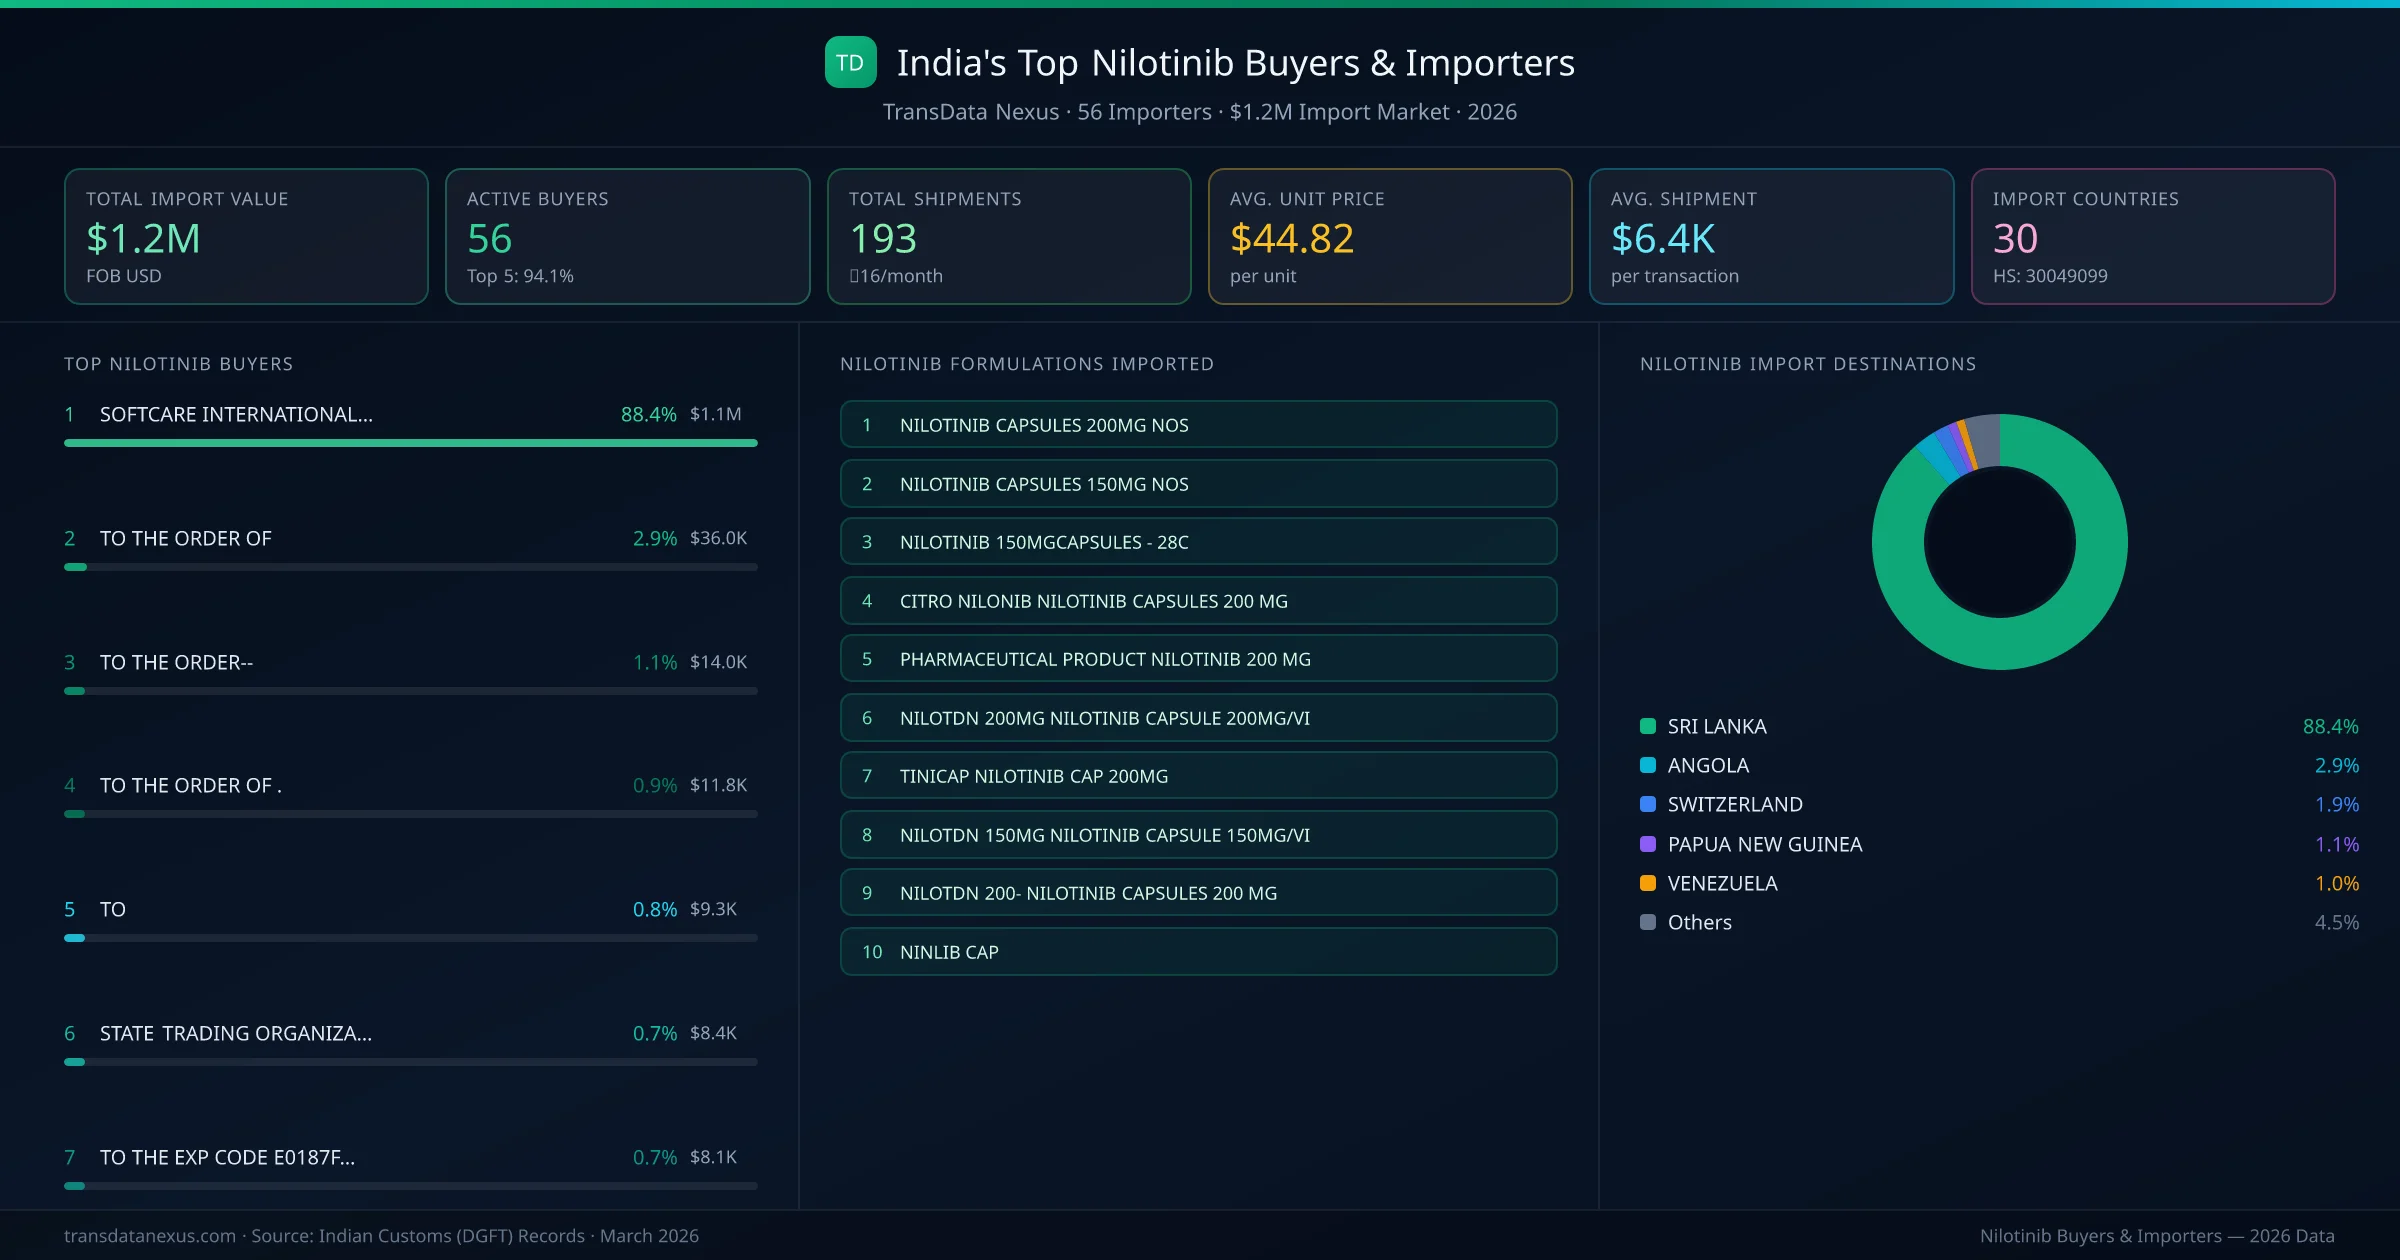
India's nilotinib import market is served by 56 active buyers who collectively imported $1.2M across 193 shipments. SOFTCARE INTERNATIONAL(PVT)LTD (SRI LANKA) leads with a 88.4% market share, followed by ASMITA COMERCIO SU LDA RUA AVENIDA PEDRO CASTRO and AS PER INVOICE AS. The top 5 buyers together control 90.3% of total import value, reflecting a concentrated buyer landscape.
Top Nilotinib Importers — Ranked by Import Value
SOFTCARE INTERNATIONAL(PVT)LTD (SRI LANKA) is the leading nilotinib importer from India, holding a 88.4% share of the $1.2M market across 193 shipments from 56 buyers. The top 5 buyers — SOFTCARE INTERNATIONAL(PVT)LTD (SRI LANKA), ASMITA COMERCIO SU LDA RUA AVENIDA PEDRO CASTRO (ANGOLA), AS PER INVOICE AS (SWITZERLAND), CUSTOMER NO UTP (ANGOLA), GENEX- COMERCIO A G,E A RETALHO, I, (ANGOLA) — collectively control 90.3% of total import value.
Top Nilotinib Buyers & Importers
Ranked by import value · 56 active buyers · Indian Customs (DGFT) data
| # | Buyer & Formulations | Value | Suppliers | Share |
|---|---|---|---|---|
| 1 | SOFTCARE INTERNATIONAL(PVT)LTDSRI LANKA NILOTINIB CAPSULES 200MG NOSNILOTINIB CAPSULES 150MG NOSNINLIB CAP | $1.1M | 5 | 88.4% |
| 2 | ASMITA COMERCIO SU LDA RUA AVENIDA PEDRO CASTROANGOLA | $8.1K | 5 | 0.7% |
| 3 | AS PER INVOICE ASSWITZERLAND PHARMACEUTICAL PRODUCT NILOTINIB 200 MGTINICAP NILOTINIB CAP 200MG | $7.6K | 5 | 0.6% |
| 4 | CUSTOMER NO UTPANGOLA | $4.1K | 5 | 0.3% |
| 5 | GENEX- COMERCIO A G,E A RETALHO, I,ANGOLA | $3.6K | 5 | 0.3% |
| 6 | DR REDDYS BEIJING PHARMACEUTICAL CO LTDCHINA PHARMACEUTICAL PRODUCT NILOTINIB 200 MG | $3.0K | 5 | 0.2% |
| 7 | DAWAA DRUG STORE LLCUNITED ARAB EMIRATES | $2.4K | 5 | 0.2% |
Related Analysis
Market Analysis: Top Importing Countries & Importers
Comprehensive geographic market intelligence dashboard
Which companies are buying Nilotinib — and from which countries?
Flow of Nilotinib exports from India: each country's share and the named importers behind the numbers
Nilotinib — Buyer Countries to Key Importers
Trade flow: top importing countries → named buyer companies

Market Analysis: Top Importing Countries & Their Importers
1Sri Lanka
Sri Lanka emerges as the first largest importing country, achieving a total trade value of $1.1M through 12 shipments. This represents a market share of 88.4% of the total market activity, demonstrating their significant presence in the industry.
Top Importers: Sri Lanka has a diverse importer base, with their top importers including:
• SOFTCARE INTERNATIONAL(PVT)LTD - $1.1M (99.9% of country's total business)
Key Insight: Sri Lanka demonstrates strong market positioning with an average shipment value of $91.7K, indicating premium pricing strategy compared to the market average of $6.4K.
Sri Lanka is a key market for Nilotinib imports, representing 88.4% of total trade value.
2Angola
Angola emerges as the second largest importing country, achieving a total trade value of $36.4K through 9 shipments. This represents a market share of 2.9% of the total market activity, demonstrating their significant presence in the industry.
Top Importers: Angola has a diverse importer base, with their top importers including:
• ASMITA COMERCIO SU LDA RUA AVENIDA PEDRO CASTRO - $8.1K (22.3% of country's total business)
• CUSTOMER NO UTP - $4.1K (11.2% of country's total business)
• GENEX- COMERCIO A G,E A RETALHO, I, - $3.6K (9.9% of country's total business)
Key Insight: Angola demonstrates strong market positioning with an average shipment value of $4.0K, indicating competitive pricing strategy compared to the market average of $6.4K.
Angola is a key market for Nilotinib imports, representing 2.9% of total trade value.
3Switzerland
Switzerland emerges as the third largest importing country, achieving a total trade value of $23.9K through 3 shipments. This represents a market share of 1.9% of the total market activity, demonstrating their significant presence in the industry.
Top Importers: Switzerland has a diverse importer base, with their top importers including:
• AS PER INVOICE AS - $7.6K (31.8% of country's total business)
Key Insight: Switzerland demonstrates strong market positioning with an average shipment value of $8.0K, indicating premium pricing strategy compared to the market average of $6.4K.
Switzerland is a key market for Nilotinib imports, representing 1.9% of total trade value.
4Papua New Guinea
Papua New Guinea emerges as the fourth largest importing country, achieving a total trade value of $14.3K through 0 shipments. This represents a market share of 1.1% of the total market activity, demonstrating their significant presence in the industry.
Key Insight: Papua New Guinea demonstrates strong market positioning with an average shipment value of $14.3K, indicating premium pricing strategy compared to the market average of $6.4K.
Papua New Guinea is a key market for Nilotinib imports, representing 1.1% of total trade value.
5Venezuela
Venezuela emerges as the fifth largest importing country, achieving a total trade value of $13.0K through 0 shipments. This represents a market share of 1.0% of the total market activity, demonstrating their significant presence in the industry.
Key Insight: Venezuela demonstrates strong market positioning with an average shipment value of $13.0K, indicating premium pricing strategy compared to the market average of $6.4K.
Venezuela is a key market for Nilotinib imports, representing 1.0% of total trade value.
Buyer Segment Analysis
TransData Nexus Nilotinib buyer market intelligence
1Buyer Segment Analysis
The importers of Nilotinib from India can be categorized into several segments:
1. Distributors: Entities like SOFTCARE INTERNATIONAL (PVT) LTD in Sri Lanka, which accounted for $1.10 million in imports, function as intermediaries, purchasing large quantities to supply to healthcare providers. Their buying behavior typically involves bulk orders to benefit from economies of scale, with a focus on maintaining a steady supply chain to meet market demand.
2. Hospital Groups: While specific hospital groups are not identified in the top buyers, such entities usually procure Nilotinib directly for patient treatment. Their purchasing patterns are characterized by regular, smaller orders aligned with patient needs and treatment schedules.
3. Retail Chains: Retail pharmacies may import Nilotinib to cater to outpatient prescriptions. Their orders are generally smaller and more frequent, aiming to manage inventory effectively and respond to prescription trends.
4. Government Procurement: Government agencies or international organizations like UNICEF and the Global Fund may engage in tender-based purchasing to supply public healthcare facilities. These procurements are often large-scale and periodic, driven by public health initiatives and budget allocations.
5. Re-exporters: Companies such as ASMITA COMERCIO SU LDA in Angola, importing $0.01 million worth of Nilotinib, may act as re-exporters, purchasing the drug for distribution to neighboring regions. Their buying behavior includes bulk purchases intended for redistribution, influenced by regional demand and trade agreements.
6. Contract Manufacturers: Entities like DR. REDDY'S BEIJING PHARMACEUTICAL CO. LTD in China, listed among the top buyers, may import Nilotinib for further processing or formulation. Their procurement patterns depend on production schedules and contractual obligations, often involving substantial quantities to support manufacturing operations.
Country-Specific Import Regulations
TransData Nexus Nilotinib buyer market intelligence
1Country-Specific Import Regulations
For the top five importing countries of Nilotinib from India, the import regulations are as follows:
1. Sri Lanka:
2. Angola:
3. Switzerland:
4. Papua New Guinea:
5. Venezuela:
Demand Drivers & Market Opportunity
TransData Nexus Nilotinib buyer market intelligence
1Demand Drivers & Market Opportunity
The demand for Nilotinib in importing countries is primarily driven by the prevalence of chronic myeloid leukemia (CML), a type of blood cancer that Nilotinib effectively treats. According to the World Health Organization (WHO), leukemia accounts for approximately 474,500 new cases globally each year, with CML representing about 15-20% of adult cases. This significant disease burden necessitates access to effective treatments like Nilotinib.
Government healthcare programs and the expansion of universal health coverage also play crucial roles in driving demand. Many countries have included Nilotinib in their national essential medicines lists, aligning with the WHO Model List of Essential Medicines, which recommends Nilotinib for the treatment of CML. Additionally, international procurement mechanisms, such as those facilitated by the Medicines Patent Pool (MPP), have expanded access to generic versions of Nilotinib in low- and middle-income countries, further increasing availability and affordability. Tender-based purchasing by government agencies and international organizations ensures a steady supply of the drug, contributing to market stability and growth.
Common Questions — Nilotinib Buyers & Importers
Answers based on Indian Customs (DGFT) shipment records compiled by TransData Nexus
QWho is the largest nilotinib buyer importing from India?
Based on import volume and value, SOFTCARE INTERNATIONAL(PVT)LTD (SRI LANKA) leads with $1.1M in imports and a 88.4% market share — the highest of any single nilotinib importer. ASMITA COMERCIO SU LDA RUA AVENIDA PEDRO CASTRO (ANGOLA) and AS PER INVOICE AS (SWITZERLAND) are the next largest buyers.
QHow many companies buy nilotinib from India?
There are 56 active nilotinib buyers importing from India, with a combined market of $1.2M across 193 shipments to 30 countries. The top 5 buyers hold 90.3% of total import value, while the remaining 51 buyers handle the other 9.7%.
QWhich countries import the most nilotinib from India?
The top importing countries for nilotinib from India are Sri Lanka (88.4%), Angola (2.9%), Switzerland (1.9%), Papua New Guinea (1.1%), Venezuela (1.0%). These markets represent the largest demand centres for Indian pharmaceutical exports of nilotinib, with buyers ranging from government procurement agencies to private pharmaceutical distributors.
QWhat is the average import order value for nilotinib from India?
The average import transaction value for nilotinib from India is $6.4K, with an average unit price of $44.82 per unit. Order sizes vary significantly based on buyer type — government tenders tend to be larger while private distributors place more frequent smaller orders.
Buyer Segment Analysis
TransData Nexus Nilotinib buyer market intelligence
1Buyer Segment Analysis
The importers of Nilotinib from India can be categorized into several segments:
1. Distributors: Entities like SOFTCARE INTERNATIONAL (PVT) LTD in Sri Lanka, which accounted for $1.10 million in imports, function as intermediaries, purchasing large quantities to supply to healthcare providers. Their buying behavior typically involves bulk orders to benefit from economies of scale, with a focus on maintaining a steady supply chain to meet market demand.
2. Hospital Groups: While specific hospital groups are not identified in the top buyers, such entities usually procure Nilotinib directly for patient treatment. Their purchasing patterns are characterized by regular, smaller orders aligned with patient needs and treatment schedules.
3. Retail Chains: Retail pharmacies may import Nilotinib to cater to outpatient prescriptions. Their orders are generally smaller and more frequent, aiming to manage inventory effectively and respond to prescription trends.
4. Government Procurement: Government agencies or international organizations like UNICEF and the Global Fund may engage in tender-based purchasing to supply public healthcare facilities. These procurements are often large-scale and periodic, driven by public health initiatives and budget allocations.
5. Re-exporters: Companies such as ASMITA COMERCIO SU LDA in Angola, importing $0.01 million worth of Nilotinib, may act as re-exporters, purchasing the drug for distribution to neighboring regions. Their buying behavior includes bulk purchases intended for redistribution, influenced by regional demand and trade agreements.
6. Contract Manufacturers: Entities like DR. REDDY'S BEIJING PHARMACEUTICAL CO. LTD in China, listed among the top buyers, may import Nilotinib for further processing or formulation. Their procurement patterns depend on production schedules and contractual obligations, often involving substantial quantities to support manufacturing operations.
Country-Specific Import Regulations
TransData Nexus Nilotinib buyer market intelligence
1Country-Specific Import Regulations
For the top five importing countries of Nilotinib from India, the import regulations are as follows:
1. Sri Lanka:
2. Angola:
3. Switzerland:
4. Papua New Guinea:
5. Venezuela:
Demand Drivers & Market Opportunity
TransData Nexus Nilotinib buyer market intelligence
1Demand Drivers & Market Opportunity
The demand for Nilotinib in importing countries is primarily driven by the prevalence of chronic myeloid leukemia (CML), a type of blood cancer that Nilotinib effectively treats. According to the World Health Organization (WHO), leukemia accounts for approximately 474,500 new cases globally each year, with CML representing about 15-20% of adult cases. This significant disease burden necessitates access to effective treatments like Nilotinib.
Government healthcare programs and the expansion of universal health coverage also play crucial roles in driving demand. Many countries have included Nilotinib in their national essential medicines lists, aligning with the WHO Model List of Essential Medicines, which recommends Nilotinib for the treatment of CML. Additionally, international procurement mechanisms, such as those facilitated by the Medicines Patent Pool (MPP), have expanded access to generic versions of Nilotinib in low- and middle-income countries, further increasing availability and affordability. Tender-based purchasing by government agencies and international organizations ensures a steady supply of the drug, contributing to market stability and growth.
Official References & Regulatory Resources
- European Medicines Agency
- WHO Essential Medicines
- Invest India — Pharma Sector
- India Trade Statistics (DGFT)
Verify import regulations and drug registration requirements with the official agencies above.
Research Methodology & Data Transparency
Suresh Sormare
Verified AuthorPharmaceutical Export-Import Analyst & Trade Intelligence Expert
Suresh Sormare is a pharmaceutical export-import analyst with deep expertise in Indian Customs (DGFT) data, HS code classification, and global pharmaceutical supply chains. His analysis covers 10M+ shipment records across 150+ countries and is used by manufacturers, procurement agencies, and trade consultants worldwide. Suresh specializes in identifying verified suppliers and buyers from customs records, mapping bilateral pharmaceutical trade corridors, analyzing tariff structures and regulatory frameworks across 170+ destination markets, and benchmarking competitive positioning for finished pharmaceutical formulations. His methodology combines granular customs transaction data with regulatory intelligence from FDA, EMA, WHO, CDSCO, and 40+ national drug authorities to deliver actionable trade insights for the pharmaceutical formulations sector.
linkedin.com/in/sureshsormarePrimary Data Source
All trade data is sourced from Indian Customs (DGFT) official shipping bill records — the authoritative government database for India's pharmaceutical trade. Each verified record contains exporter name, consignee (buyer) name, detailed product description, quantity, declared FOB value (USD), port of loading, destination country, and shipment date.
Analysis Methodology
- 1.Buyer Identification: 56 global importers of Nilotinib identified from consignee fields in DGFT shipping bill records.
- 2.Import Value Analysis: Total import value aggregated from 193 individual shipping bill records. Values are FOB in USD.
- 3.Statistical Normalization: Shipment values are statistically normalized to ensure accurate market share representation.
- 4.Geographic Distribution: Buyer imports distributed across 30 destination countries with market share per buyer calculated from capped values.
Government-Sourced Data
Official DGFT customs records
Transparent Methodology
Calculations fully disclosed above
193 Verified Shipments
56 buyers tracked
Expert-Reviewed
By pharmaceutical trade specialists