India to United States Pharmaceutical Export
Bilateral Trade Intelligence · $8.8B Total Trade · 792 Exporters · 2262 Buyers · DGFT Verified · Updated March 2026
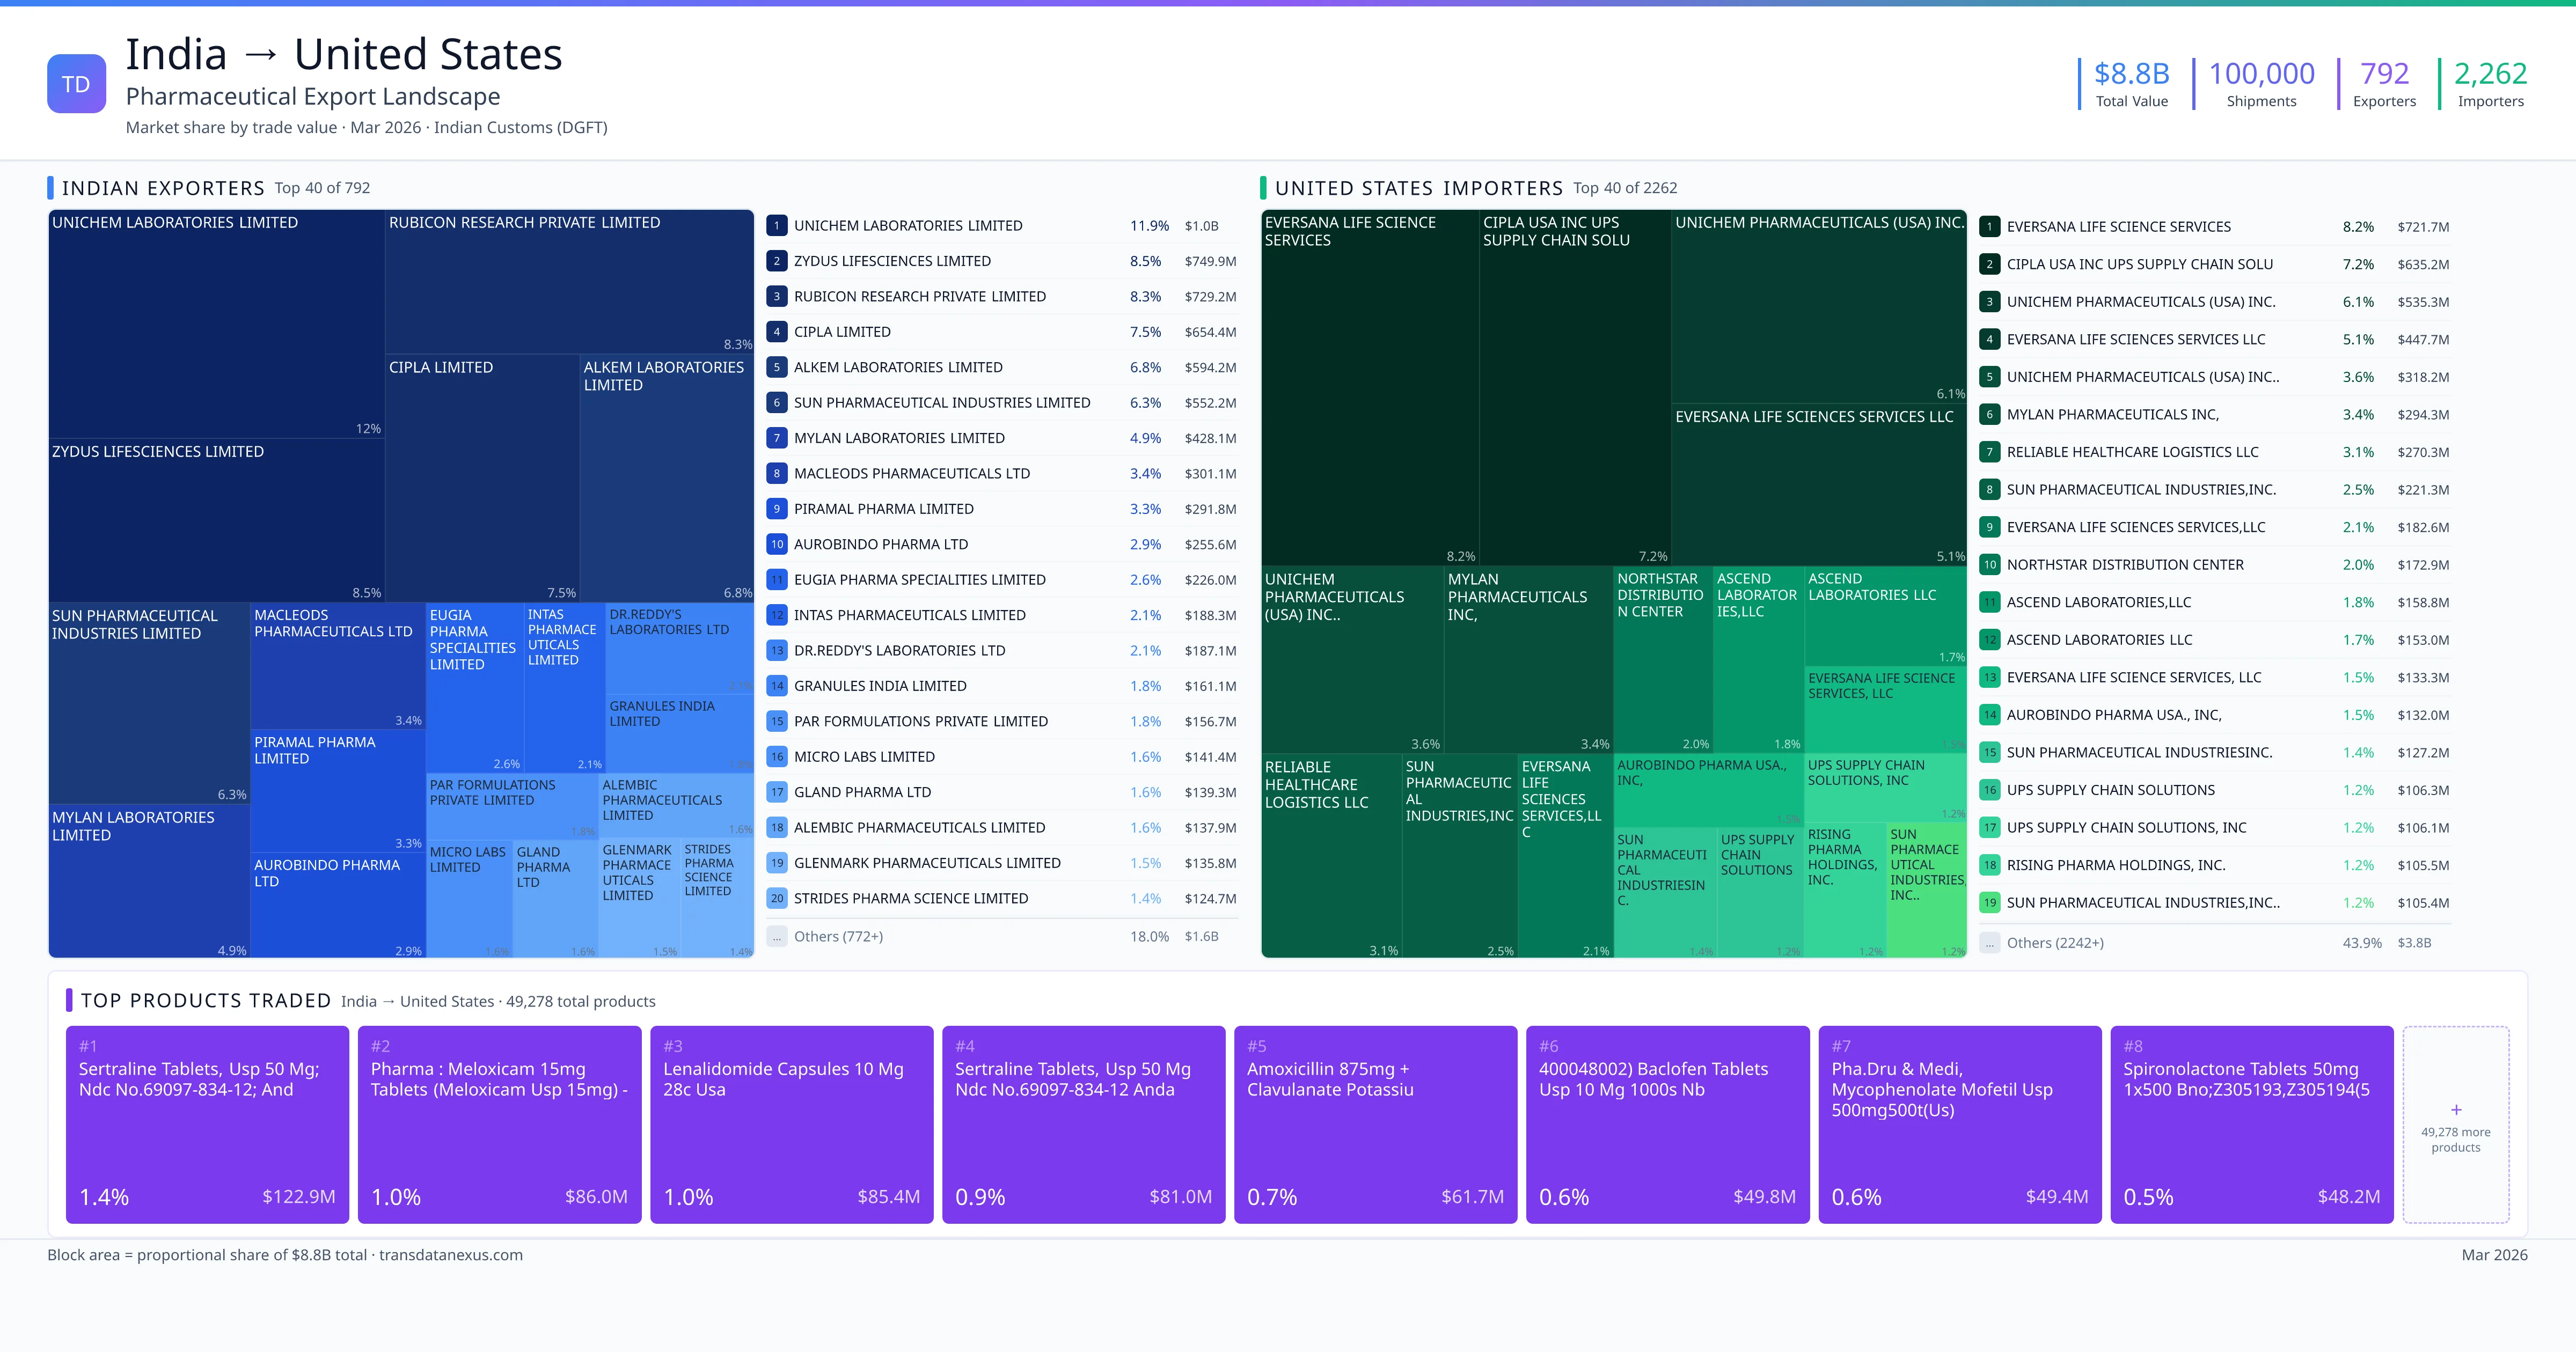
India exported $8.8B worth of pharmaceutical formulations to United States across 100,000 verified shipments, sourced from 792 Indian exporters supplying 2262 United States buyers. The top exporters are UNICHEM LABORATORIES LIMITED ($1.0B) and ZYDUS LIFESCIENCES LIMITED ($749.9M). The leading products are Sertraline ($122.9M) and Lenalidomide ($85.4M). Average shipment value: $87.8K.
Top Pharmaceutical Formulations — India to United States
| # | Formulation | Value | Share |
|---|---|---|---|
| 1 | Sertraline Tablets, USP 50 Mg; Ndc No.69097-834-12; Anda No.:077397 Pack Size1… | $122.9M | 1.4% |
| 2 | Lenalidomide Capsules 10 MG 28c USA | $85.4M | 1.0% |
| 3 | Amoxicillin 875mg + Clavulanate Potassiu | $61.7M | 0.7% |
| 4 | 400048002) Baclofen Tablets USP 10 MG 1000s Nb | $49.8M | 0.6% |
| 5 | Pha.dru & Medi, Mycophenolate Mofetil USP 500mg500t(us) Mycophenolate Mofetil T… | $49.4M | 0.6% |
| 6 | Spironolactone Tablets 50mg 1x500 Bno;z305193,z305194(5340 Packs) | $48.2M | 0.5% |
| 7 | Finished Formulation Amlodipine Besylate 10mg Tablets 1000t USP Amlodipine Besy… | $47.4M | 0.5% |
| 8 | (440044013) Hydroxyzine Hydrochloride Tablets Usp25mg 1000's | $45.1M | 0.5% |
| 9 | Allopurinol 300mg Tablets 500t Allopurinol Tablets.usp 300 MG Ndc Code: 2930035… | $44.8M | 0.5% |
| 10 | Pharma : Losartan Potassium 50mg Tablets - 2136 Btls X1000 Tablets | $44.4M | 0.5% |
| 11 | Pharma : Hydrochlorothiazide 25mg Tablets - 14544btls X 1000 Tablets | $43.6M | 0.5% |
| 12 | Lenalidomide Capsules 10mg | $43.5M | 0.5% |
| 13 | Pharma : Meloxicam 15mg Tablets (meloxicam USP 15mg) - 7308 Btls X 1000 Tablets | $43.4M | 0.5% |
| 14 | Pharmaceutical Formulations Succinylchol | $42.7M | 0.5% |
| 15 | Pha.dru & Medi, Anastrozole Tablets 1 Mgeach Film Coated Tablet Contains Anastr… | $42.7M | 0.5% |
India exports 20+ pharmaceutical formulations to United States with a combined trade value of $8.8B. Key products include Sertraline ($122.9M), Lenalidomide ($85.4M), Amoxicillin ($61.7M), Spironolactone ($48.2M), Amlodipine ($47.4M). These are finished dosage forms — tablets, capsules, injectables, and combination drugs — shipped from Indian manufacturing facilities with FDA, WHO-GMP, and EU GMP certifications. Data from 100,000 verified Indian Customs (DGFT) shipment records.
Top Pharmaceutical Products — India to United States Trade Routes
These are the top pharmaceutical products exported from India to United States, each with a dedicated trade route analysis page. Click any product to see detailed export data including Indian suppliers, United States buyers, regulatory requirements, and logistics for that specific product corridor. Products include Sertraline ($122.9M), Lenalidomide ($85.4M), Amoxicillin ($61.7M), Spironolactone ($48.2M), Amlodipine ($47.4M) — all finished pharmaceutical formulations verified from Indian Customs (DGFT) records.
Top Indian Exporters to United States
792 Indian pharmaceutical companies export finished formulations to United States. Leading exporters include Unichem Laboratories Limited, Zydus Lifesciences Limited, Rubicon Research Private Limited, Cipla Limited. The top exporter accounts for 11.9% of total India–United States pharma exports. Source: Indian Customs (DGFT).
Top United States Buyers from India
2262 companies in United States import pharmaceutical formulations from India. Top buyers include Eversana Life Science Services, Cipla Usa Inc Ups Supply Chain Solu, Unichem Pharmaceuticals (usa) Inc., Eversana Life Sciences Services Llc. The largest buyer accounts for 8.2% of India–United States pharma imports. Source: Indian Customs (DGFT).
Port Analysis — India to United States Pharmaceutical Shipments
Indian Export Ports
United States Import Ports
Trade Statistics
Other Destinations
Product Routes
FAQ — India to United States Pharmaceutical Trade
What is the total value of India's pharmaceutical export to United States?
India exported pharmaceuticals worth $8.8B to United States across 100,000 verified shipments.
Who are the top Indian pharmaceutical exporters to United States?
1. UNICHEM LABORATORIES LIMITED — $1.0B. 2. ZYDUS LIFESCIENCES LIMITED — $749.9M. 3. RUBICON RESEARCH PRIVATE LIMITED — $729.2M. Total: 792 suppliers.
Which companies in United States import pharmaceuticals from India?
1. EVERSANA LIFE SCIENCE SERVICES — $721.7M. 2. CIPLA USA INC UPS SUPPLY CHAIN SOLU — $635.2M. 3. UNICHEM PHARMACEUTICALS (USA) INC. — $535.3M. 2262 buyers total.
What pharmaceutical products does India export most to United States?
1. Sertraline Tablets, USP 50 Mg; Ndc No.69097-834-12; Anda No.:077397 Pack Size1… ($122.9M, 1.4%); 2. Lenalidomide Capsules 10 MG 28c USA ($85.4M, 1.0%); 3. Amoxicillin 875mg + Clavulanate Potassiu ($61.7M, 0.7%); 4. 400048002) Baclofen Tablets USP 10 MG 1000s Nb ($49.8M, 0.6%); 5. Pha.dru & Medi, Mycophenolate Mofetil USP 500mg500t(us) Mycophenolate Mofetil T… ($49.4M, 0.6%)
Which ports handle pharmaceutical shipments from India to United States?
Export: NHAVA SHEVA SEA, DELHI AIR, LCS JAIGAON, MUNDRA SEA, SAHAR AIR. Import: NEW YORK, Savannah, SAVANNAH, NORFOLK, New York.
Why does United States import pharmaceuticals from India?
India's cost-competitive generic drug manufacturing, WHO-GMP certified facilities, and broad product portfolio. This $8.8B corridor reflects quality compliance and pricing advantages.
What certifications do Indian pharmaceutical exporters need to supply United States?
WHO-GMP certification, EU GMP approval (for EU markets), product dossier registration (CTD format), and ICH guideline compliance.
What is the average shipment value for India to United States pharmaceutical trade?
$87.8K per consignment across 100,000 shipments.
How many Indian pharmaceutical companies export to United States?
792 Indian companies. Largest: UNICHEM LABORATORIES LIMITED with $1.0B.
How can I find verified Indian pharmaceutical suppliers for United States?
TransData Nexus covers 792 active exporters with shipment history and trade values at transdatanexus.com.
Unlock the Full India to United States Pharmaceutical Export Dataset
Access complete shipment records, supplier intelligence, buyer histories, and price analytics for all 100,000 shipments.
Official References & Regulatory Resources
- WHO Essential Medicines List
- CDSCO India
- IBEF — India Pharma Industry
- Ministry of Commerce — Pharma Exports
- Pharmexcil
Data sourced from Indian Customs (DGFT) records. Verify regulatory status with the agencies above.
Research Methodology & Data Transparency
Suresh Sormare
Verified AuthorPharmaceutical Export-Import Analyst & Trade Intelligence Expert
Suresh Sormare is a pharmaceutical export-import analyst with deep expertise in Indian Customs (DGFT) data, HS code classification, and global pharmaceutical supply chains. His analysis covers 10M+ shipment records across 150+ countries and is used by manufacturers, procurement agencies, and trade consultants worldwide. Suresh specializes in identifying verified suppliers and buyers from customs records, mapping bilateral pharmaceutical trade corridors, analyzing tariff structures and regulatory frameworks across 170+ destination markets, and benchmarking competitive positioning for finished pharmaceutical formulations. His methodology combines granular customs transaction data with regulatory intelligence from FDA, EMA, WHO, CDSCO, and 40+ national drug authorities to deliver actionable trade insights for the pharmaceutical formulations sector.
linkedin.com/in/sureshsormarePrimary Data Source
All trade data is sourced from Indian Customs (DGFT) official shipping bill records — the authoritative government database for India's pharmaceutical trade. Each verified record contains exporter name, consignee (buyer) name, detailed product description, quantity, declared FOB value (USD), port of loading, destination country, and shipment date.
Analysis Methodology
- 1.Data Source: Indian Customs (DGFT) export shipping bill records covering all pharmaceutical shipments from India.
- 2.Country Matching: Shipments to United States identified using destination country codes from customs declarations.
- 3.Statistical Normalization: Values are statistically normalized to remove outlier transactions and ensure accurate market share representation.
- 4.Coverage: 100,000 verified shipments from 792 Indian exporters to 2262 United States buyers.
Government-Sourced Data
Official DGFT customs records
Transparent Methodology
Calculations fully disclosed above
792 Exporters
2262 buyers tracked
Expert-Reviewed
By pharmaceutical trade specialists